When the stock markets start to slide, it can be difficult to stay invested. But time and again, financial professionals have cautioned that falling markets can turn on a dime when things seem only slightly less bleak than the day before. Historically, every severe downturn has eventually given way to further growth.
Despite market pullbacks, stocks have risen over the long term
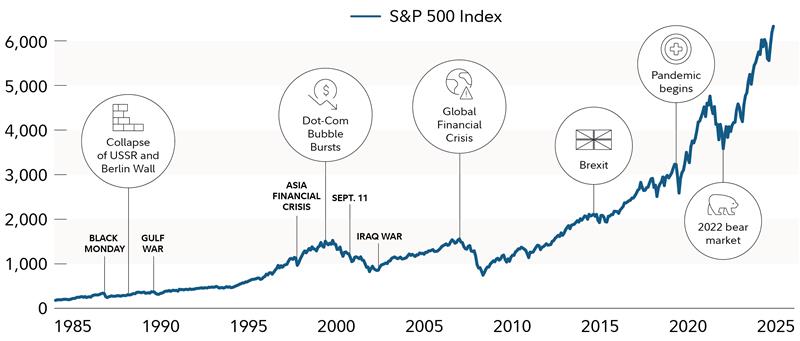
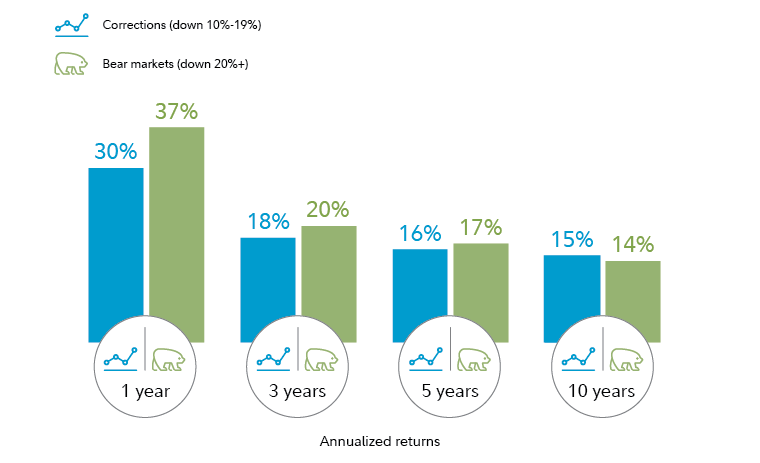
No one knows when the next market downturn will happen, how long it will last, and what the recovery will look like. But we do know that these patterns have played out in similar ways in recent market pullbacks. Days with unimaginable losses have sometimes been followed quickly by days with large gains. Historically, the market has eventually gotten through these periods and gone on to produce positive returns—the largest of which often come right after big selloffs.
Median returns following large stock market selloffs (1950–2022)
Steps to consider now
Consider these 9 ways to make sure your retirement saving and investing plan is on track through down markets so you're positioned to benefit from potential growth later.
1. Try to stay disciplined with your investing
Staying invested through downturns can seem counterintuitive but it can be key to benefiting from potential rallies and the long-term growth potential of the stock market. Missing just a few of the best days in the market can undermine long-term return potential.
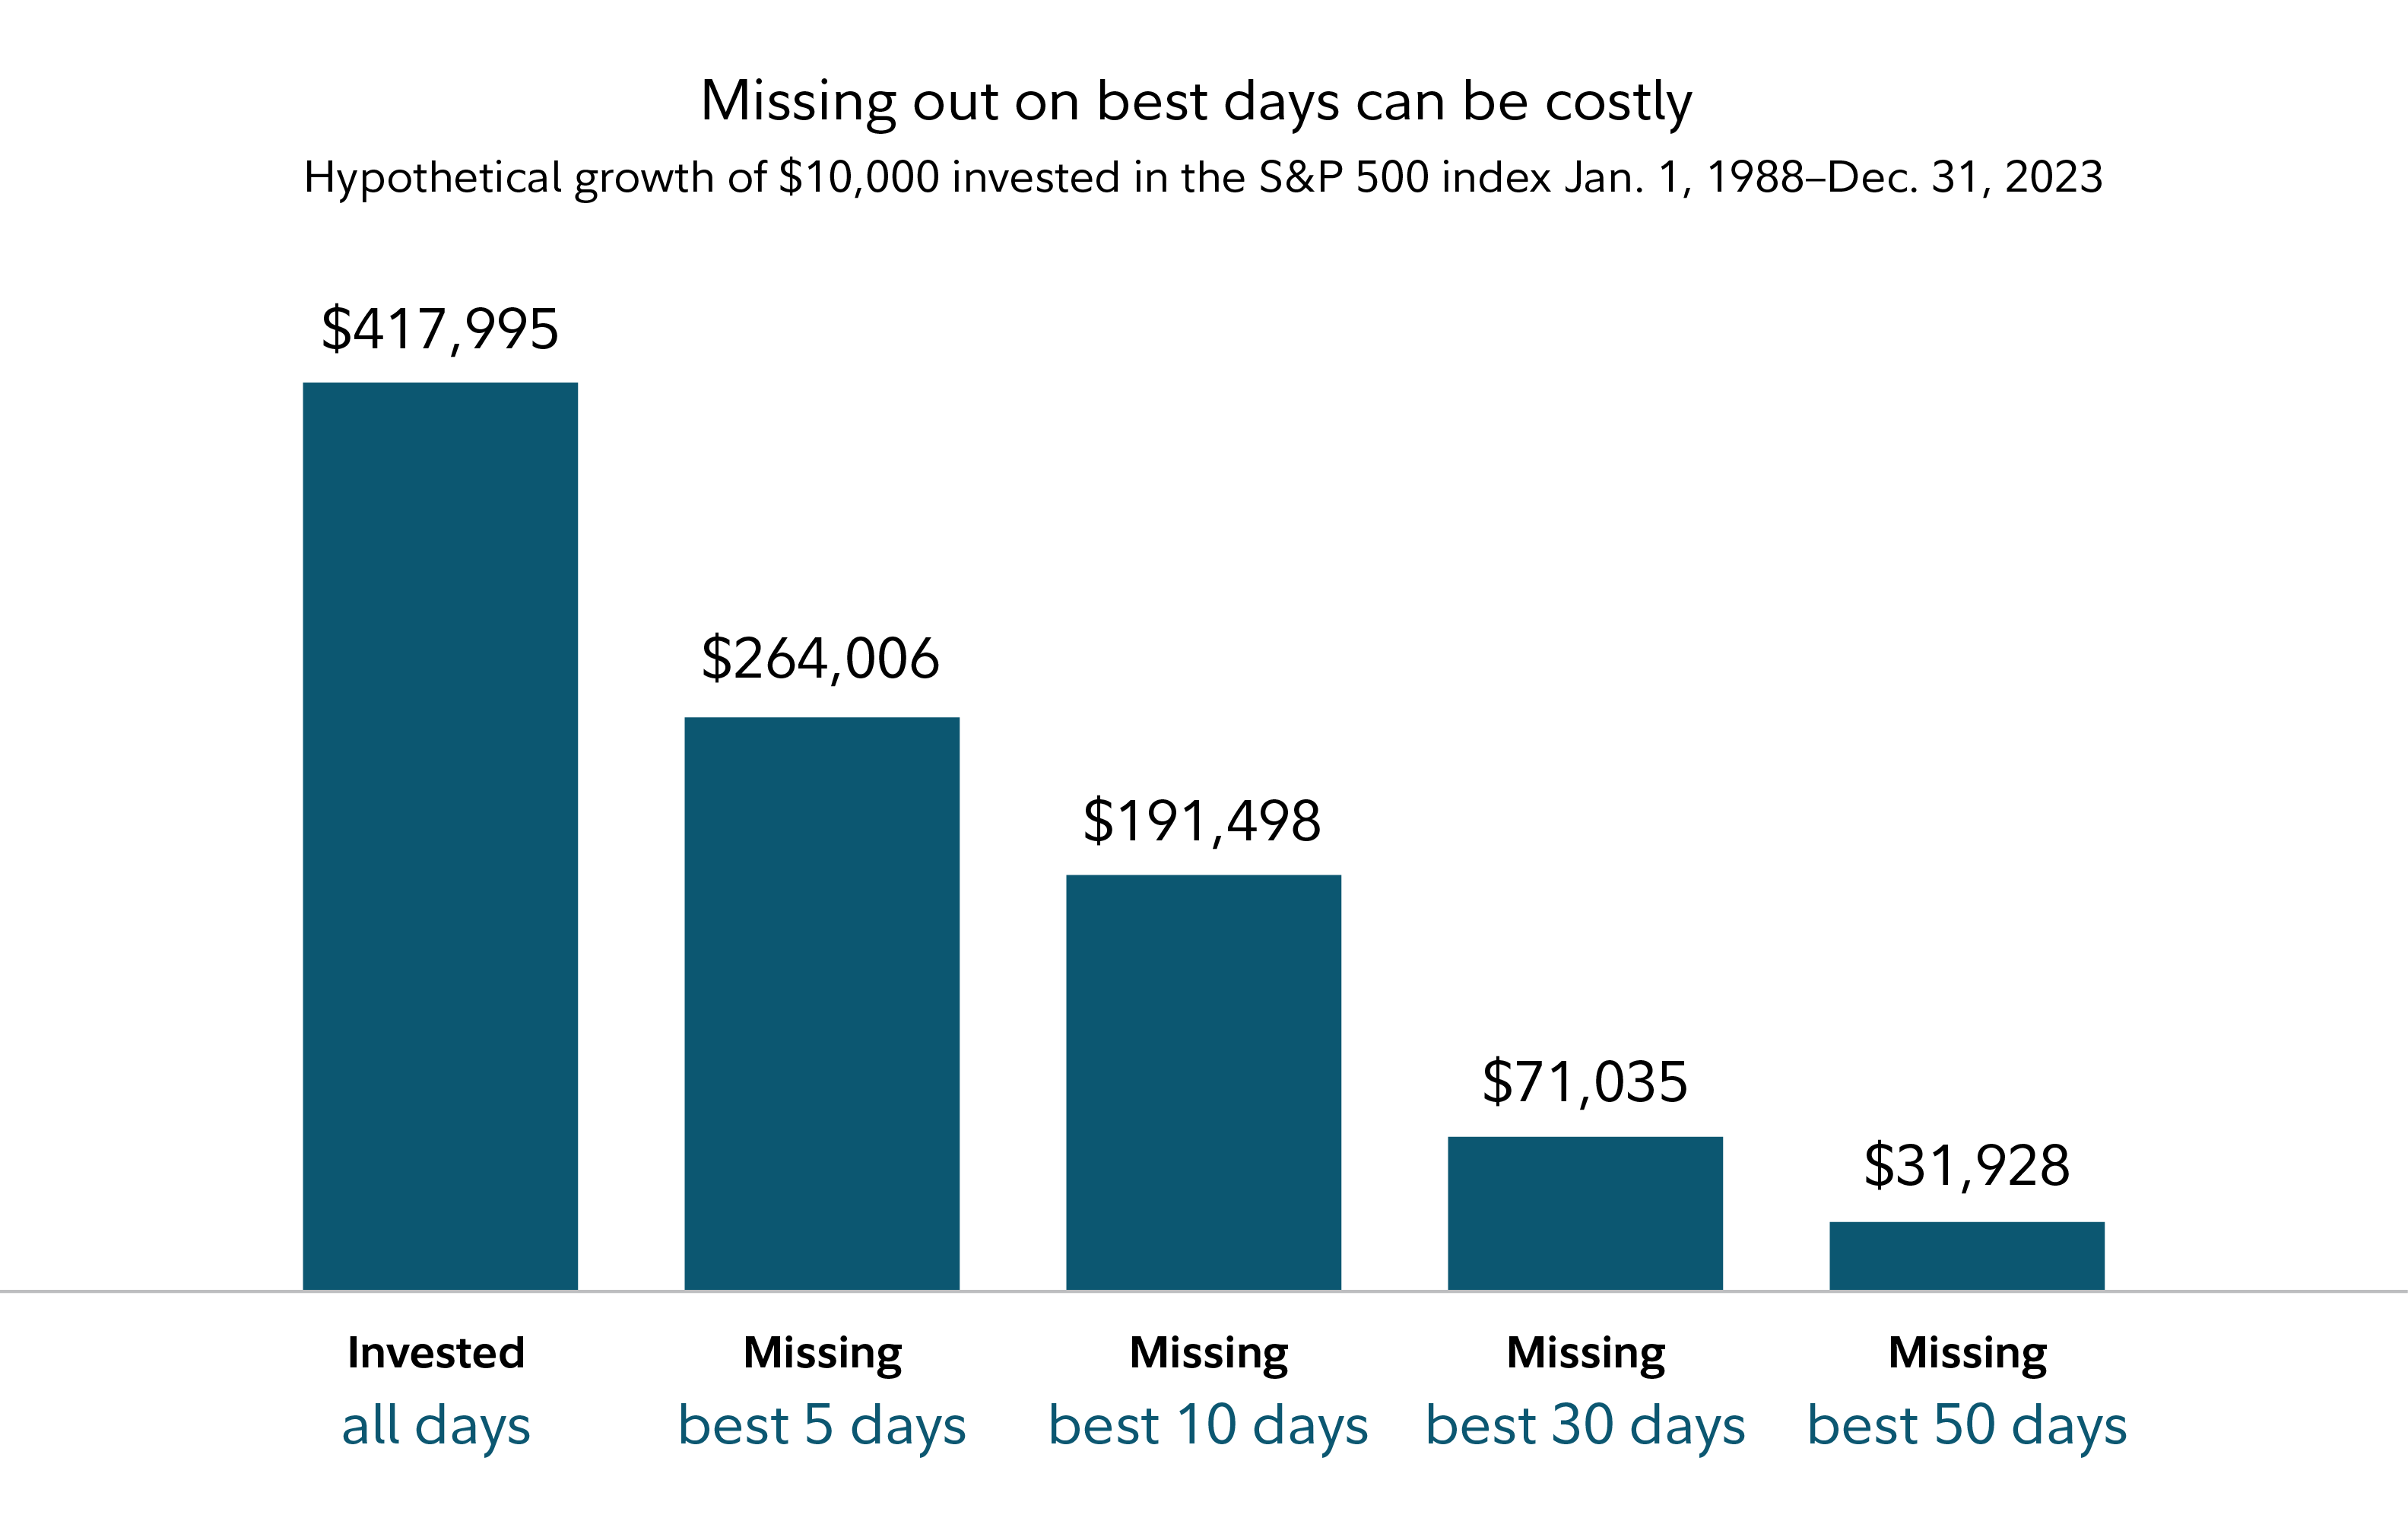
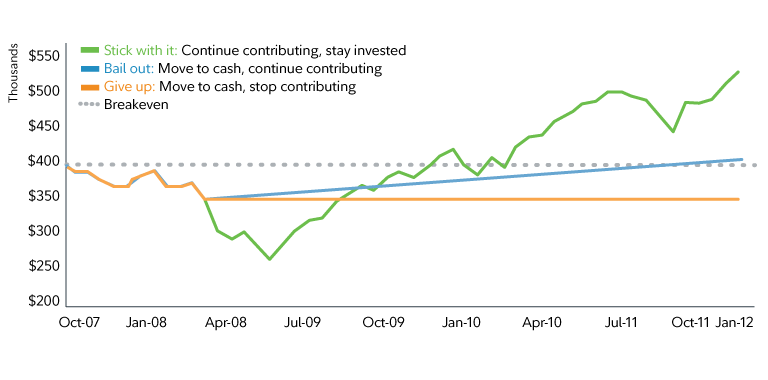
Here are 3 actions that an investor saving for retirement could have taken during the Global Financial Crisis in 2007–2009 and the long-term effect on their savings.
Give up: Sell all stocks and stop making contributions.
Bail out: Sell all stocks and leave the money in cash, but keep saving.
Stick with it: Don't sell. Continue making new workplace contributions and stick with their investment plan, including annual rebalancing.
As you can see, continuing to save and invest through the Global Financial Crisis would have helped the investor's account recover from the downturn and take advantage of subsequent growth.
Continuing to save and invest may help grow your money
Investors who stuck it out after the global financial crisis were first to recover
2. Work to maintain a diversified investment mix
Setting and maintaining your diversified asset allocation are among the most important ingredients in your potential long-term investment success. Though diversification and asset allocation won't ensure gains or guarantee against losses, they may smooth out returns for the level of risk you choose to target.
Read Viewpoints on Fidelity.com: The guide to diversification
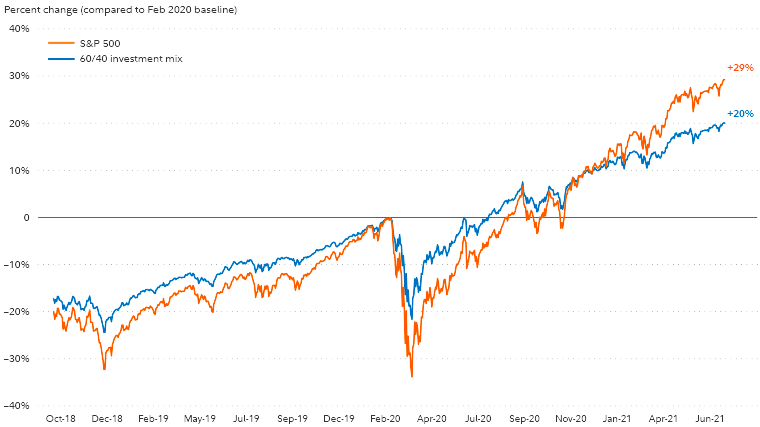
Diversification can help smooth the ups and downs of your portfolio
2020: S&P 500 vs. 60% stocks/40% bonds investment mix
3. Consider reviewing investments at least annually and rebalancing as needed
Big shifts in the market can throw your plan off its track. For instance, if you had a portfolio with about 60% stocks and about 40% bonds in January 2020, the portfolio would have been closer to 52% stocks by the end of March 2020. That might mean your portfolio has less growth potential than planned. Rebalancing your investment mix can help ensure that your plan stays on target with your long-term asset allocation.
As a general rule, Fidelity suggests rebalancing if your mix of stocks, bonds, and cash veers more than 5%–10% from its target weight in your portfolio, resulting in more or less risk than your plan calls for. It can also be a good idea to evaluate your investment mix if your life goals change.
Read Viewpoints on Fidelity.com: Give your portfolio a checkup
4. Already sold out of the market? Think about reinvesting
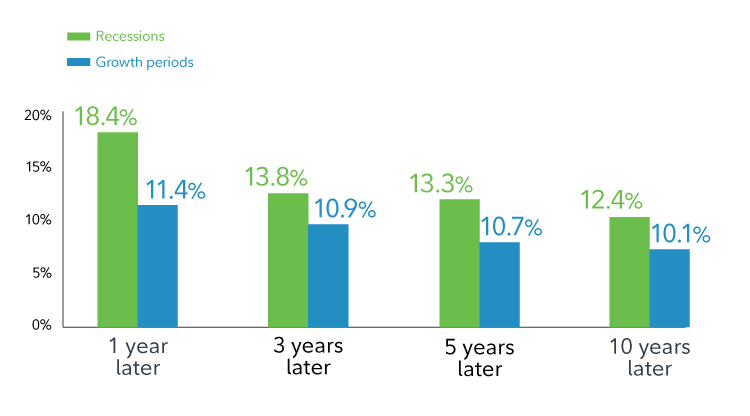
Seller's remorse can happen to anyone. If you've sold all your investments and are currently on the sidelines, it can be difficult to catch up. But there's good news: You can reinvest. Because stocks have typically experienced volatility heading into and during recessions, investors have had opportunities to acquire stocks at discounts to their previous valuations.
Historically, when stocks have recovered from their recession levels, they have typically delivered strong returns. So even though it can be disconcerting to invest when the economy is shaky and markets are down, the growth potential has historically benefited investors who stuck with their investments through the recession or started investing during that time.
Investing during recessions has historically led to strong investment results
If jumping back into the market seems too risky now, consider a dollar-cost-averaging strategy by putting a set dollar amount into a portfolio each month. While dollar-cost averaging won't insulate you from losses or guarantee a profit in a volatile market, investors can purchase more shares when prices are lower, and fewer when they are higher. But for dollar-cost averaging to be effective, an investor must continue to make investments in both up and down markets.
5. Look for opportunities to cut taxes
When investing outside of tax-advantaged accounts (like an IRA, 401(k), or HSA), the taxes generated by investments may lower your after-tax returns.
Strategies like tax-smart asset location or tax-loss harvesting may help reduce the impact of taxes.
- An asset location strategy can help ensure that your investments are held in accounts where you pay the lowest possible taxes.
- Tax-loss harvesting may allow you to offset taxes on realized gains. And, if you have more capital losses than gains, you can use up to $3,000 a year to offset ordinary income on federal income taxes and carry over the rest to future years.
Read Viewpoints on Fidelity.com: How to invest tax-efficiently
6. Evaluate your emergency savings
Generally, while you're working and saving for retirement, it's a good idea to keep 3 to 6 months of essential expenses in cash or cash-like investments (for example, a money market fund). As you move toward retirement, building up your cash savings to cover a year or more of essential expenses may help you feel more comfortable and prepared for the unexpected. Feeling more prepared for downturns can help you stay invested for the long term.
7. Try to maximize savings
If you're able to increase the amount you're saving toward your long-term goals, saving more may help offset the impact of market downturns. You may also be able to buy more of your investments in a downturn. If nothing else, a market downturn may be an opportunity to revisit your plan and confirm that your investment mix and the amount you're saving are in line with your time horizon, risk tolerance, and financial situation.
8. Stress test your plan to see if it's on target
After big stock market swings, review your plan to understand if it's still on target. If it's not, there may be steps you can take to get back on track.
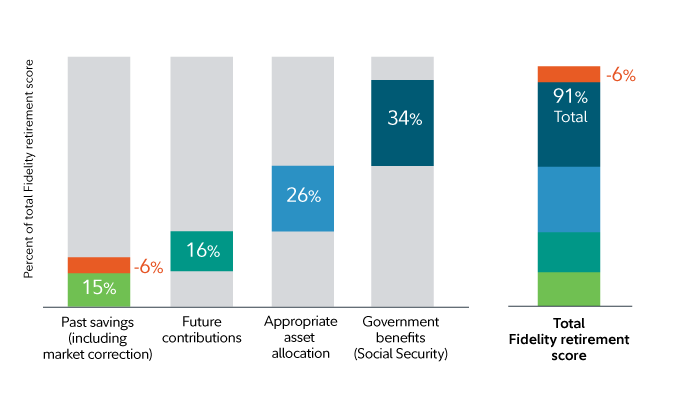
Consider Suzie, a hypothetical 45-year-old saver. Before the downturn in 2020, her Fidelity retirement score was 97%, meaning she was on track to cover 97% of her expected expenses in retirement. After stocks dropped 25%, her score dropped 6 percentage points to 91%.
This is illustrated in the graphic below. The first 4 columns represent the factors that make up Suzie's current retirement score. In the fifth column, the red bar indicates the impact of the market downturn on that portion of the current retirement score.
Is your retirement plan on target? Find out with the Fidelity retirement score
The good news is, Suzie has options. She has time to increase her savings before retirement. Staying invested appropriately for her time horizon also contributes to her overall readiness for retirement. If Suzie were invested too conservatively or stopped saving, her retirement score would go down far more than what resulted from the market pullback.
Stock market swings can affect your retirement readiness
Staying invested appropriately can help you recover
IMPORTANT: The projections or other information generated by Fidelity Retirement Score regarding the likelihood of various investment outcomes are hypothetical in nature, do not reflect actual investment results, and are not guarantees of future results. Results may vary with each use and over time.
The Fidelity Retirement Score is a hypothetical illustration and does not represent your individual situation or the investment results of any particular investment or investment strategy, and is not a guarantee of future results. Your score does not consider the composition of current savings and other factors.
The first 4 columns represent the factors that make up the current retirement score, in the fifth column. The red bar indicates the impact of the market downturn on that portion of the current retirement score.
This hypothetical illustration assumes Suzie, the saver, is 45 years old and planning for retirement at age 65. Her current income is $100,000 and annual estimated retirement expenses are assumed to be $70,000. The value of her retirement savings is $500,000 with a 15% annual contribution, including the match from her employer. Her savings are invested in 70% stocks and 30% bonds. Based on the assumed work history, pre-tax Social Security retirement benefits are assumed to be $27,000. For the complete methodology used in this example, see footnote 4.
The Fidelity retirement score estimates the percentage of a retirement income goal that a user or household is estimated to replace in underperforming market conditions. View the complete Retirement Analysis Methodology (PDF).
9. Nearing retirement? Review your investments and create an income plan
As you near retirement, your time horizon may be changing. To help get ready, consider these steps.
Review your asset mix. Your personal situation and financial plan are the critical factors in your investment decisions. But it can often make sense to reduce the amount of stocks in your investment mix in order to reduce the level of exposure to stock market risk as you move toward retirement, when you'll begin withdrawing from your investments.
Build a diversified income plan. To help ensure that you're able to cover essential expenses, consider a layered approach to your retirement income. That can mean using guaranteed sources of income—like Social Security, pensions, or annuities5—to cover fixed expenses such as housing. That way, your investment accounts are funding discretionary expenses. That can give you the flexibility to pare back the spending from your investment accounts during down markets if it makes you more comfortable.
To learn more, read Viewpoints on Fidelity.com: 3 keys to your retirement income plan
In the short term, extreme market fluctuations are painful. But over time, they may have much less of an impact on long-term goals than one might fear. That's because focusing on the things you can control, and continuing to save and stay invested with a diversified plan, can have an even bigger impact on the outcome.


