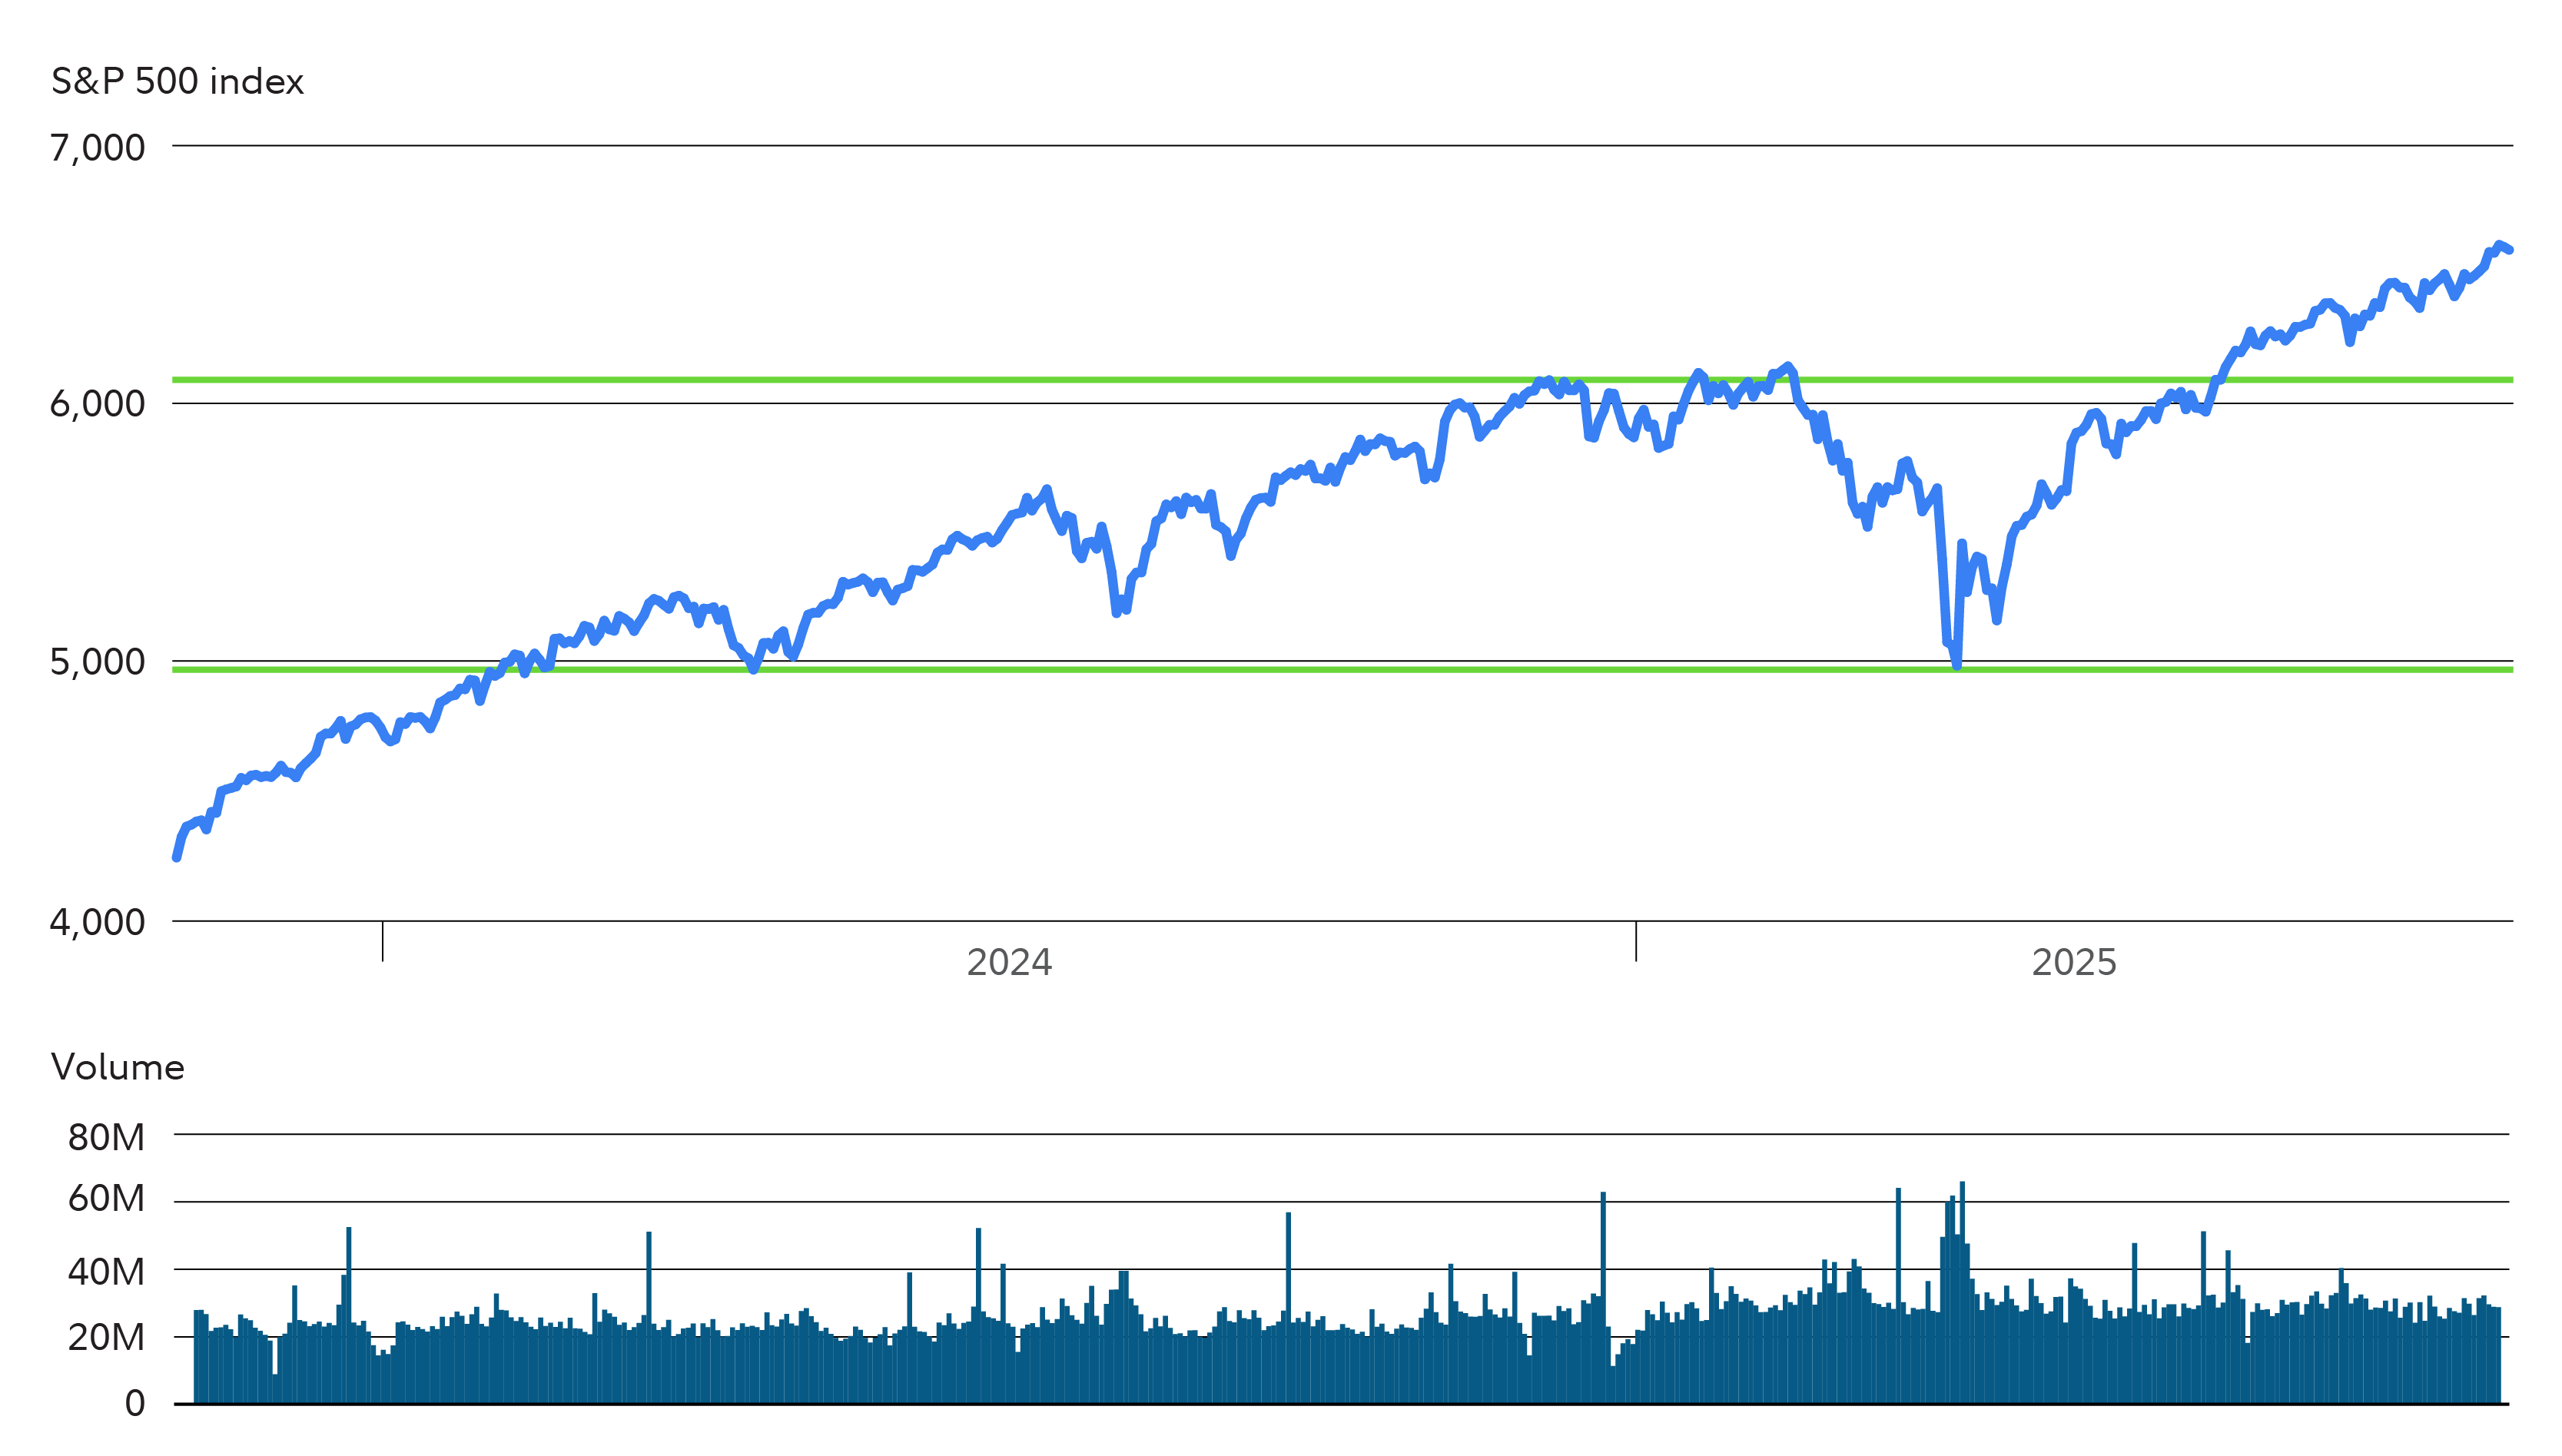
Stocks have continued to make record highs. The Federal Reserve's widely anticipated September quarter-point rate cut helped extend a rally that's pushed the S&P 500 more than 13% higher year to date. Based on a chart of US stocks using a channel trading system, an early summer breakout to new highs has stocks in a bullish trend.
What channels say about stocks now
What exactly is a channel? Basically, it's a price range that a stock or other investment trades within over a period of time. It can be loosely identified when the price touches (or comes close to touching) a high and low several times, but does not move far outside this range over some period of time—typically no shorter than a few weeks or months. The chart of the S&P 500 below shows what a channel may look like (look for the green horizontal lines).
Stocks rise above ceiling

Channels can reveal potentially important price levels. The 2 significant price levels for a channel are the "floor" or bottom price and the "ceiling" or top price. The floor can be thought of as a support level because the stock may have a tendency not to fall below the floor price. The ceiling can be thought of as a resistance level because the stock may have a tendency not to rise above the ceiling price.
As the chart shows, stocks have rallied substantially since breaching just above 6,000—which had served as a ceiling in early 2025.
A support/resistance level, once breached, may serve as a new resistance/support level (e.g., if a stock falls below a support level, that's a bearish move where that price can now be viewed as a resistance level, and vice versa). Consequently, when a stock does break through the ceiling or the floor of a channel, chart users consider that to be a potentially noteworthy price move, and possibly the beginning of a new trend. If stocks were to turn lower, the channel's ceiling price would be considered a significant price level to watch.
More specifically, if a stock price breaks through the ceiling of a channel and goes higher, this may signify a bullish move and might generate a buy signal. Alternatively, if a stock price breaks through the floor of a channel and goes lower, this may signify a bearish move and might generate a sell signal.
It is also possible for channels to exist in uptrends or downtrends. In an uptrend, a rising channel might exist where the ceilings are gradually increasing (think vaulted ceilings), while the floors are also gradually increasing (like a ramp).
Trading within a channel
Not only can you use channels to generate trade signals when the price breaks above a ceiling or below a floor, it is also possible to trade a stock as it moves within the channel. For instance, if you spotted a channel forming between $40 and $50, you might consider placing buy orders when the stock neared $40 and placing sell orders when the stock neared $50. This is because these 2 prices levels may be technically significant as a floor and a ceiling.
Of course, this trading approach has unique risks involving market timing, which is exceedingly difficult for anyone. If you did implement this strategy, you may also want to consider some risk management by placing stop/stop-limit orders at prices above and below the buy and sell prices, to help protect yourself against losses. It's important to know that stop orders do not guarantee execution at a particular price, and therefore do not necessarily provide protection against losses.
There is another point that is worth considering when assessing a channel. According to many chart analysts, the longer a stock remains in a channel, the more powerful the strength of a breakout is deemed to be. For example, if a stock were in a channel for 6 months and finally broke through a ceiling price, the strength of that bullish breakout might be considered more credible than if the stock had traded in the channel for only a few weeks.
Channeling your trading power
Signals given by technical patterns—like channels—should never be used in isolation, which is to say that fundamental and economic factors are the core drivers of the market. Earnings, central bank moves, and other market forces remain the most important factors that will dictate market direction. However, if you like using chart patterns, including channels, they can help optimize your strategy.


