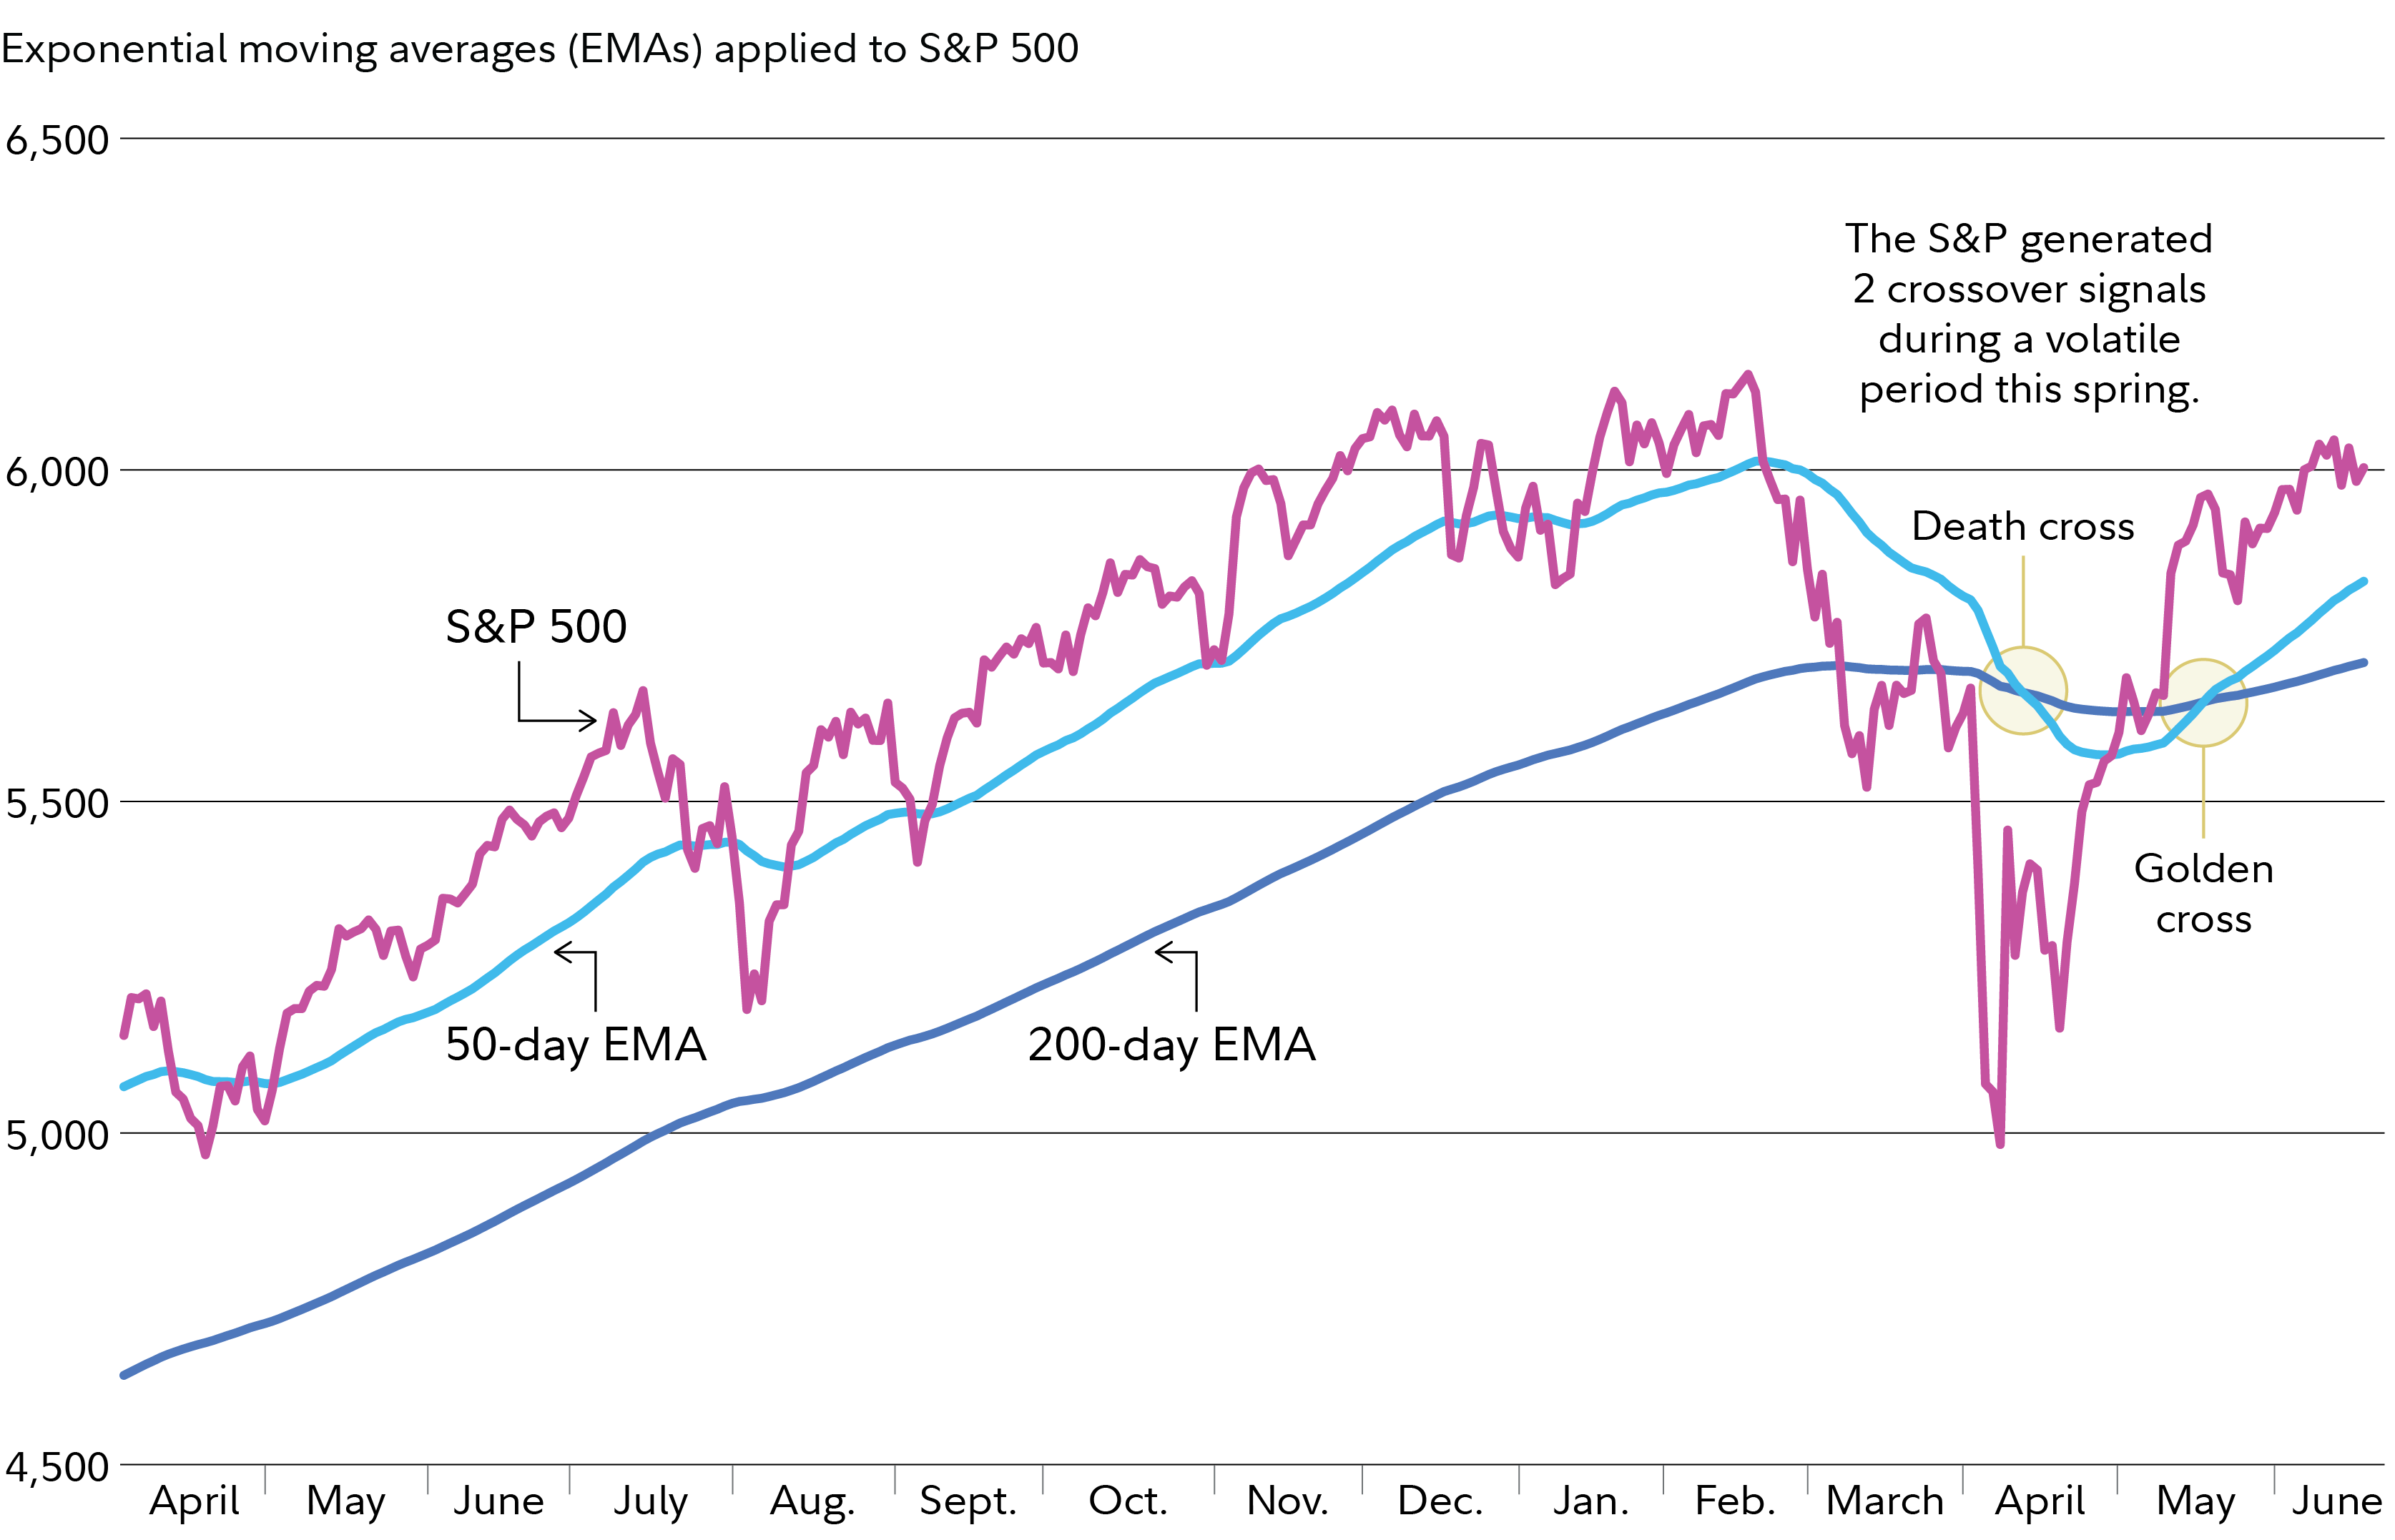
It's been an up-and-down first half for stocks. But the S&P 500 recaptured 6,000 this month, having erased all year-to-date losses. And a recent golden cross moving average signal may affirm that momentum. Here's what this chart indicator says about stocks.
What are moving averages?
Among all the technical analysis tools at your disposal, moving averages are one of the easiest to understand and use in your strategy.
A mean is simply the average of a set of numbers. A moving average is a (time) series of means; it's a "moving" average because as new prices are made, the older data is dropped and the newest data replaces it. The primary purpose of moving averages is to smooth out the data you're reviewing to help get a clearer sense of the trend.
Trading platforms may let you choose between different moving average indicators (e.g., simple or exponential). A simple moving average (SMA) is calculated by adding all the data for a specific time period and dividing the total by the number of days. An exponential moving average (EMA), which is also known as a weighted moving average, assigns greater weight to the most recent data.
Many traders prefer using EMAs because they place more emphasis on the most recent market developments. You can also choose the length of time for the moving average. A commonly used setting is to apply a 50-day EMA and a 200-day EMA to a price chart (see Moving averages applied to the S&P 500 chart).

A longer moving average, such as a 200-day EMA, can serve as a valuable smoothing device when you are trying to assess long-term trends. A shorter moving average, such as a 50-day moving average, will more closely follow the recent price action and therefore is frequently used to assess short-term patterns. Shorter-term moving averages are frequently referred to as "fast" because they change direction on the chart more quickly than a longer moving average. Alternatively, longer-term moving averages can be referred to as "slow."
Each moving average can serve as a price support and resistance level as well as key price targets. If the price of a stock, index, or other investment is above a moving average, that moving average price can serve as a strong support level—meaning if the current price declines, it might have a more difficult time falling below the moving average price level. Alternatively, if the current price is below a moving average, that moving average price can serve as a strong resistance level—meaning if the current price were to increase, it might struggle to rise above the moving average price level. If a stock does fall below a support level, that may be considered a short-term sell signal. Alternatively, if a stock rises above a resistance level, that can be considered a short-term buy signal.
Stock moving average crossover signal
As the S&P 500 chart above shows, US stocks are currently trading above their 50-day (light blue line) and 200-day (dark blue line) EMA. With the S&P 500 trading near 6,000, both moving averages may be support levels going forward.
Different moving averages can also be used in combination to generate what is perceived by many traders as a powerful "crossover" trading signal. The crossover method involves buying or selling when a shorter moving average crosses a longer moving average.
A buy signal is generated when a shorter-term moving average crosses above a longer-term moving average. For example, the "golden cross" occurs when the 50-day exponential moving average crosses above a 200-day moving average. Alternatively, a sell signal is generated when a short moving average crosses below a long moving average.
It's worth noting that the S&P has generated 2 crossover signals in a relatively short period of time. A death cross happened in mid-April and a golden cross occurred more recently in mid-May. Crossover signals do not typically happen this frequently, and market volatility appears to be causing some abnormal chart activity. With that said, the most recent signal was a golden cross, which chart users would interpret as a powerful bullish signal.
Moving average chart tips
Obviously, a golden cross or a death cross does not suggest that you should mechanically buy or sell. Remember, indicators like moving averages can generate signals that you may not want to act upon, depending on your strategy. With that said, moving averages can be helpful at any time, and are considered to be particularly useful in upward or downward trending markets.
As always, each investment opportunity you consider should be evaluated on its own merit, including how it aligns with your investment objectives, risk preferences, financial circumstances, and investing time frame. Moving averages can be used in combination with other technical and fundamental data to help form your outlook on an individual stock and on the overall stock market. Right now, moving averages are suggesting the bulls may keep running. However, given recent events in the Middle East, investors may want to exercise caution trading chart signals.


