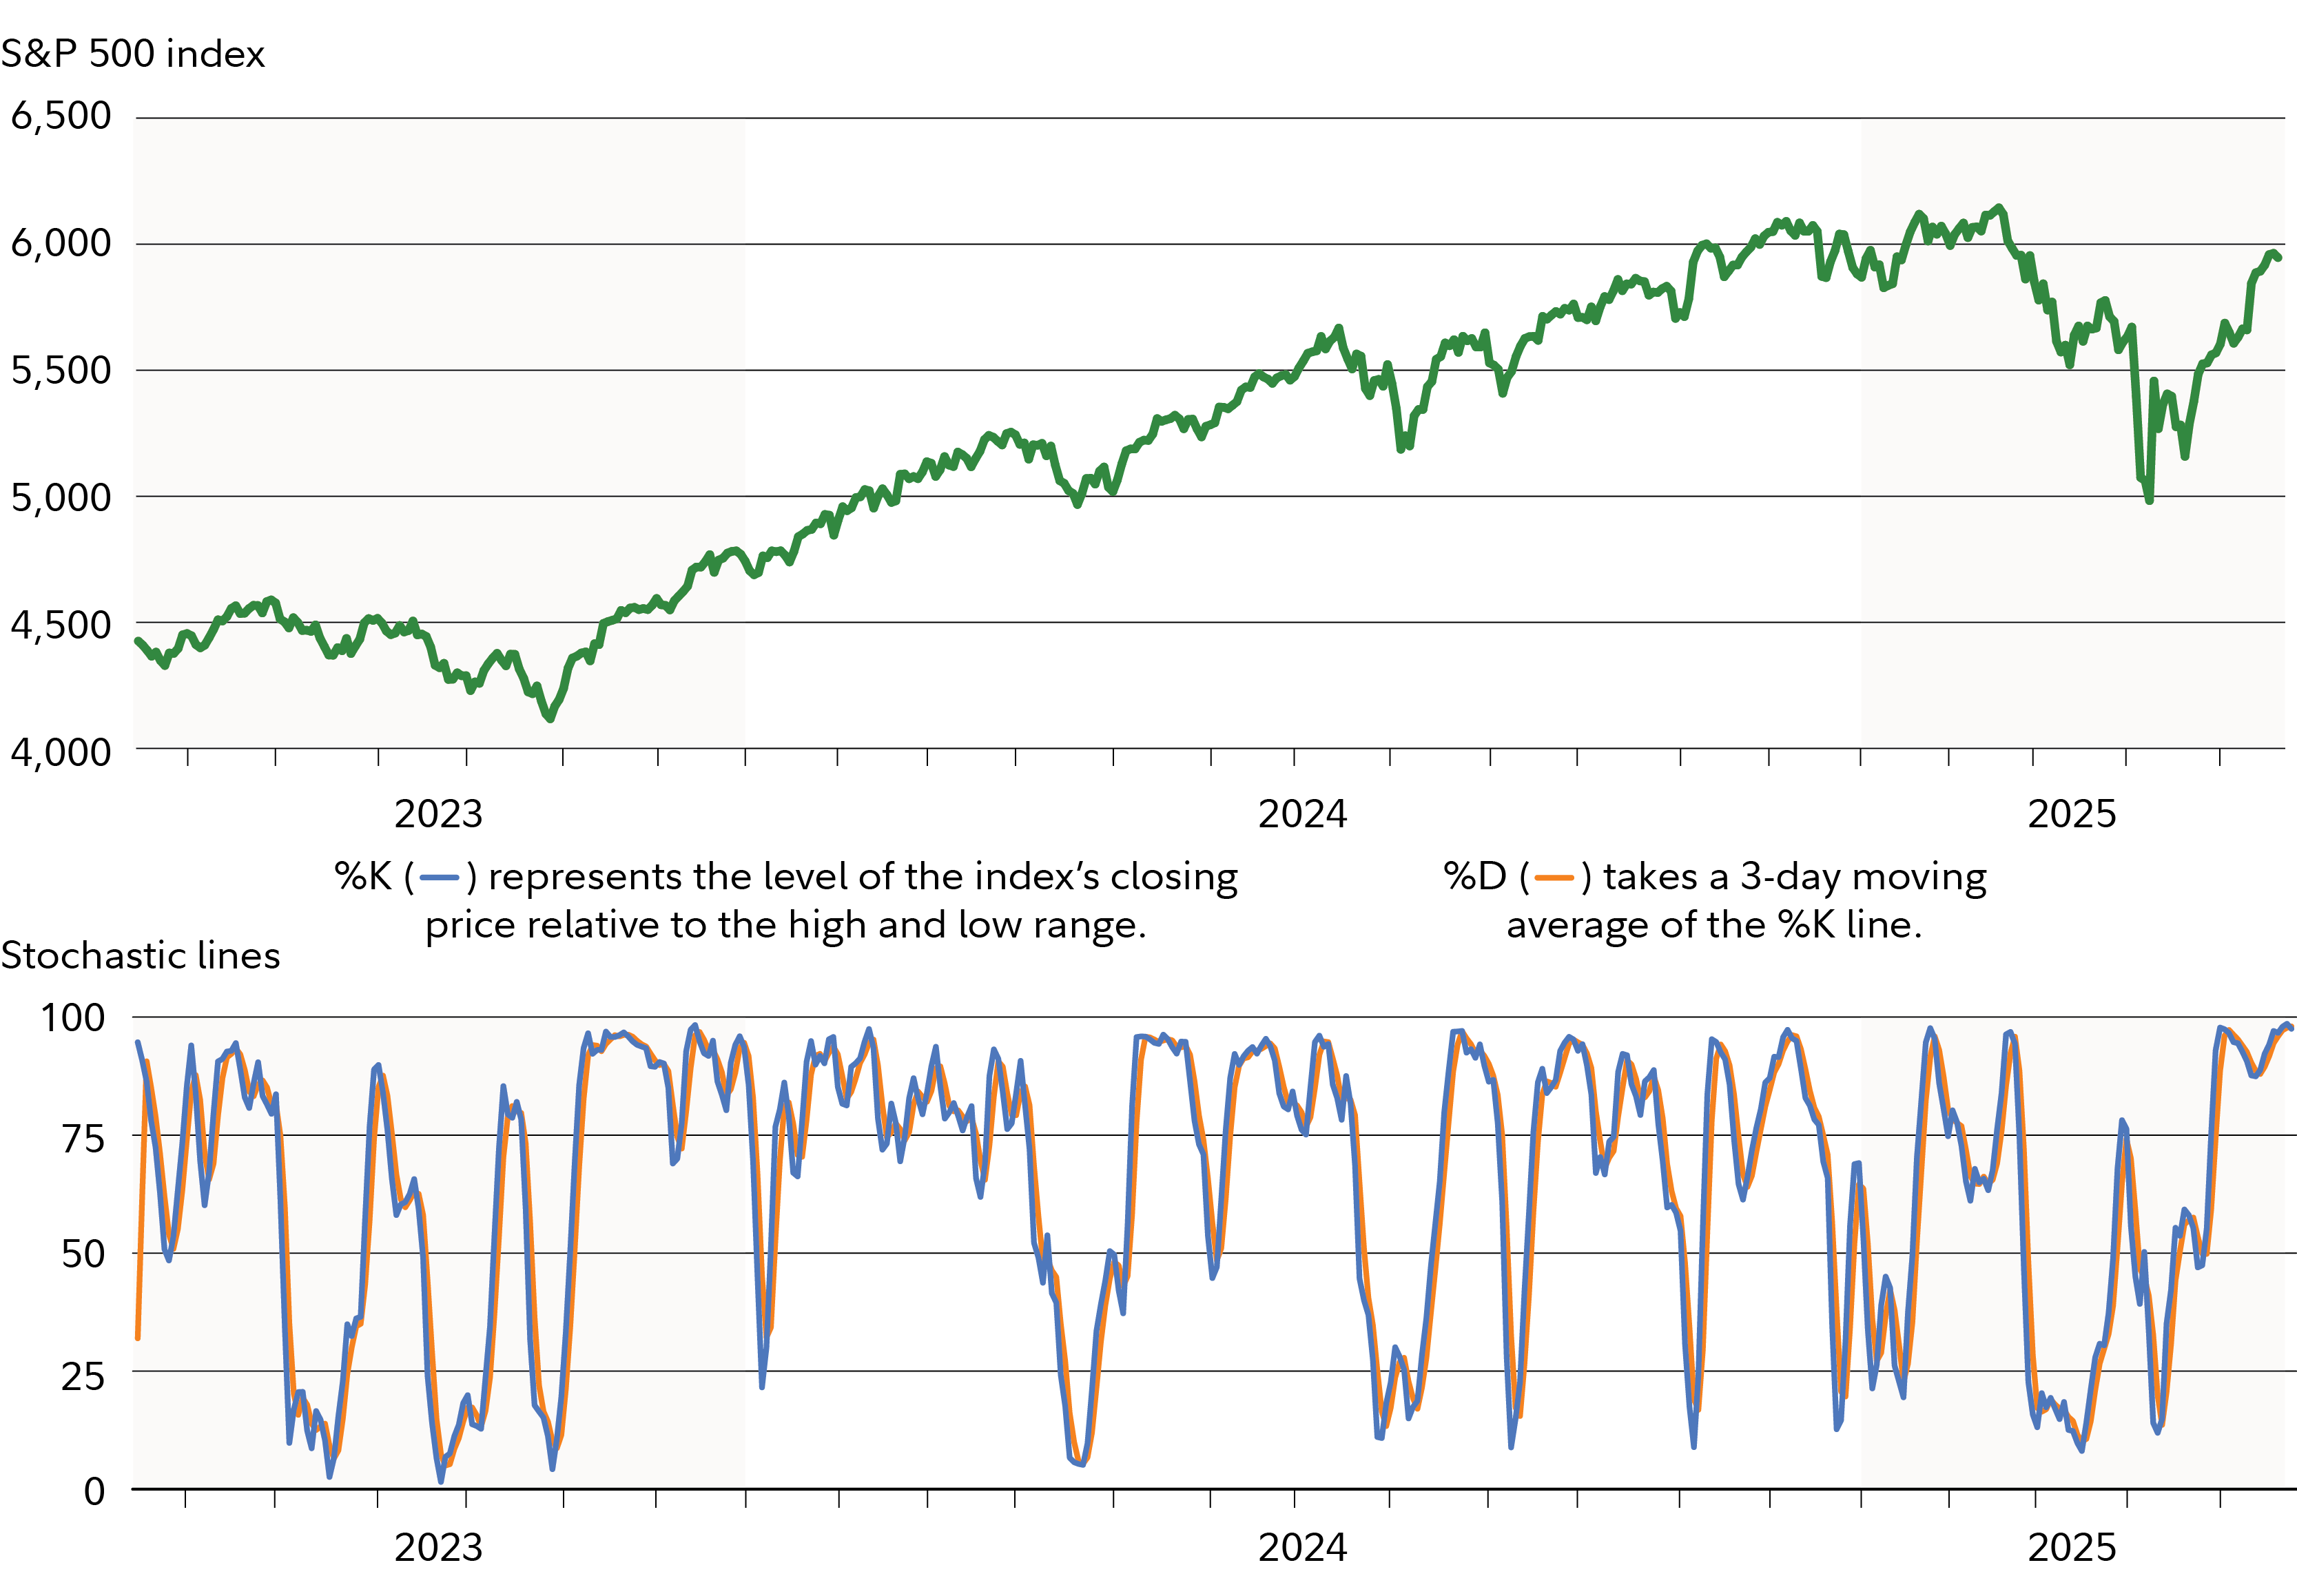
Stocks turned positive year to date this past week and are within striking distance of the S&P 500's February 2025 all-time high above 6,100. This despite the continuing presence of economic worries that helped drive the market into correction territory earlier this spring—the latest of which was the US credit rating downgrade by Moody's from AAA to Aa1.
Where might stocks go from here? Based on stochastics, the short-term outlook suggests stocks may be expensive.
What are stochastics?
Stochastics are a momentum measure that ranges from 0 to 100. If you add this indicator to your charts, stochastics can typically be found beneath the price chart (see Stochastics applied to the S&P 500 below).
Stochastics applied to the S&P 500®

Stochastics are made up of 2 lines, which tend to move in tandem. %K (blue line in the bottom half of the chart above) represents the level of the stock or index's closing price relative to the high and low range over a specified period of time, and %D (orange line in the bottom half of the chart above) attempts to smooth out the %K line by taking a 3-day moving average of the %K line. %D is generally considered the more important of the 2 lines.
The theory behind stochastics is that these lines generate buy or sell signals when closing prices are near recent extreme highs or lows (i.e., sell signals after an uptrend and buy signals after a downtrend). Generally, the area above 80 indicates an overbought region, while the area below 20 is considered an oversold region. When stochastics are above 80 and move below that number, it indicates a sell signal. When stochastics are below 20 and move above that number, it indicates a buy signal. 80 and 20 are the most common signal levels used, but can be adjusted per individual preferences.
Momentum indicators like stochastics are typically considered more valuable in sideways markets, compared with uptrends or downtrends, because of the way they oscillate between relatively overbought and oversold prices.
What are stochastics saying about stocks now?
The rapid rally since the early-April lows has stocks not far from their all-time highs. Looking at the chart above of the S&P 500 with slow stochastics applied, the last crossover signal generated by stochastics was a buy signal on April 9—when stochastics crossed above the 20 line. Currently, both the %D and %K line are trading above 80, as of late May. That suggests stocks are overbought. Active investors can watch for a cross below the 80 level for a sell signal, based on this indicator.
Another pattern that can be observed when using stochastics is a divergence between the direction of the stochastics indicator and a stock or index, such as the S&P 500. Divergences form when a new high or low in price is not confirmed by a new high or low in stochastics. A bullish divergence, for example, forms when price makes a lower low but stochastics form a higher low. This could indicate less downward momentum and could foreshadow a bullish reversal. A divergence has not occurred recently, as both the S&P 500 and stochastics have trended in the same direction for the most part in recent months.
Stochastics and stocks
It's worth noting that, once a trading signal is generated by a technical indicator such as stochastics, that doesn't necessarily mean that signal (to buy or sell) stays in effect until a contrary signal is generated. Rather, it can be thought of as a trading indicator that is relevant for a short period of time (e.g., a few days or weeks) after it is generated.
Also, momentum indicators—including stochastics—can remain above 80 in overbought levels for extended periods after an upturn, without indicating that the security is becoming more overpriced. Similarly, stochastics can remain below 20 in oversold territory for extended periods after a sustained downtrend, without meaning the stock is becoming more oversold.
Of course, you shouldn't take a trading action based solely on this one signal. Like any technical indicator, stochastics are best used in combination with other data points, macroeconomic analysis of the market and business cycle, and, if used with individual stocks, an analysis of earnings and more company fundamentals.


