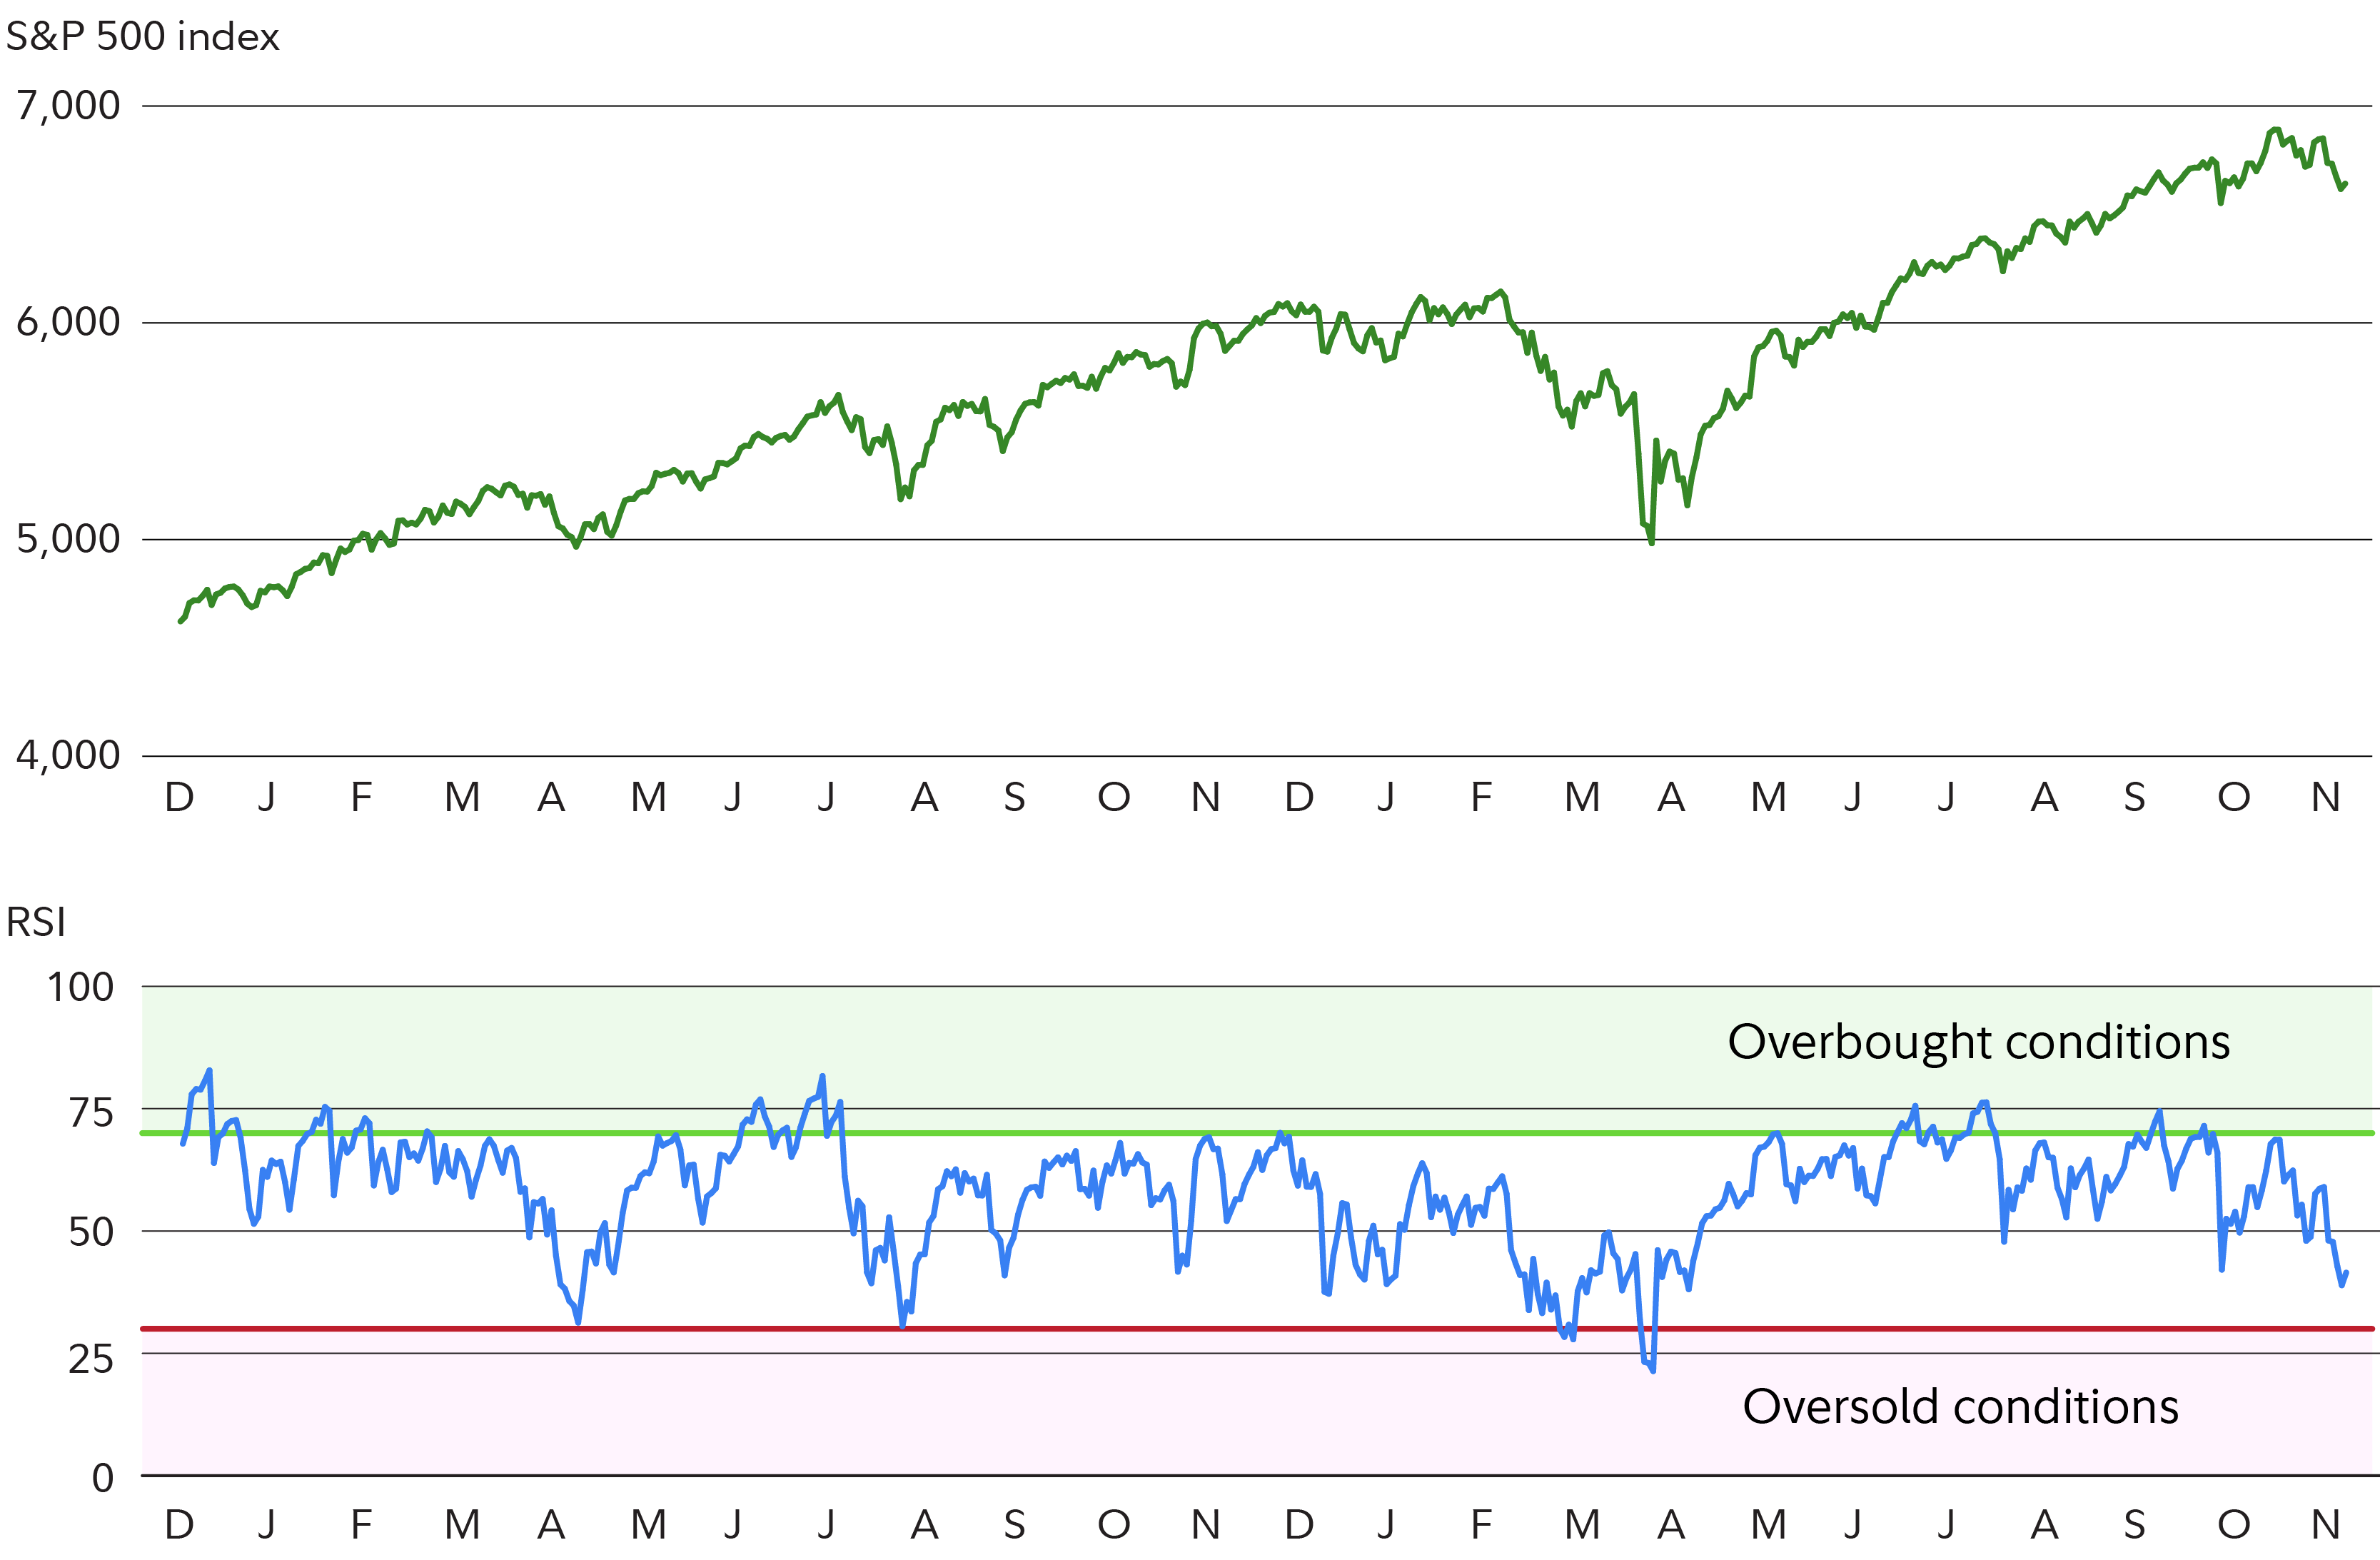
Stocks have weakened a bit in November, slowing the market's momentum after hitting record highs at the end of October. If you actively trade, the relative strength index is an indicator that can help you evaluate which direction stocks may head over the short term. RSI currently suggests that stocks may become oversold, which would be a buy signal.
What RSI says about stocks
RSI is used to determine whether an investment is overbought or oversold by measuring the speed and change of price movements. It's intended to evaluate the relative value of a stock, index, or other investment using recent price history. RSI is a momentum oscillator, a type of technical indicator that fluctuates in a range, usually from 0 to 100. It is calculated using the average gain and average loss over a defined period of time. Like other oscillators, RSI is considered to be most applicable in non-trending markets (i.e., not clearly trending up or down).
In the chart below, RSI is the blue line in the section below the S&P 500 price. Low RSI levels, typically below 30 (red line), indicate oversold conditions—generating a potential buy signal. Conversely, high RSI levels, typically above 70 (green line), indicate overbought conditions—generating a potential sell signal.
RSI applied to the S&P

Stocks have rallied to record highs this year, but have mostly moved sideways over the past month. Rising worries about jobs, inflation, and other factors have slowed some of the market's momentum. At the same time, RSI has come down from overbought levels and is approaching oversold territory. If it were to continue to fall, that would generate a short-term buy signal.
Some RSI users adjust these rules based on their own preferences. Instead of using 30 and 70 as oversold and overbought levels, for example, one common modification is to widen the parameters to 20 and 80. Here, if RSI were to drop to 20, that would generate a buy signal. Alternatively, if RSI were to rise to 80, this would generate a sell signal.
Trading signals generated by RSI are generally thought to be most valid when values reach an extreme reading near the upper or lower end of the boundaries. An RSI reading near 100 (the top of the RSI scale) would be greater evidence of overbought conditions (a sell signal), while an RSI reading near 0 (the bottom of the RSI scale) would suggest oversold conditions (a buy signal). Trading signals generated by RSI may also be given more credence when the reading rises above 70 and stays above that level for an extended period of time, or drops below 30 and stays below that level for an extended period of time.
More ways to use RSI
RSI can remain in overbought or oversold territory for an extended period of time (weeks or even months). That is, if RSI were to move above 70 or below 30, it would not be uncommon for it to remain above or below those levels for some period of time without retreating back to neutral RSI territory between 30 and 70 (or between 20 and 80, depending on the levels that you use).
In addition to the overbought and oversold signals that RSI can generate, it is possible to dig a little deeper into the relationship between RSI and the price action of the stock or index. A positive RSI reversal, for example, might occur when RSI makes a lower low (a relative low point on the chart that is below the most recent previous low) but the price is starting to make a higher low (a relative low on the chart that is higher than the most recent previous low). This would be a bullish move, generating a buy signal. It appears a positive reversal may have taken place over the past several weeks. A negative reversal could occur when RSI forms a higher high, but the price forms a lower high. This would be a bearish move, generating a sell signal.
RSI in action
It should go without saying that you shouldn't trade on this indicator alone. RSI and other chart indicators should be used in conjunction with fundamental analysis, business cycle analysis, and any other information that aligns with your strategy. More importantly, trends in inflation, potential moves by the Fed, earnings results, and other factors have the power to override any chart trends. With that said, this indicator is signaling short-term investors may want to be at the ready.


