
Description
The Relative Strength Index (RSI), developed by J. Welles Wilder, is a momentum oscillator that measures the speed and change of price movements. The RSI oscillates between zero and 100. Traditionally the RSI is considered overbought when above 70 and oversold when below 30. Signals can be generated by looking for divergences and failure swings. RSI can also be used to identify the general trend.
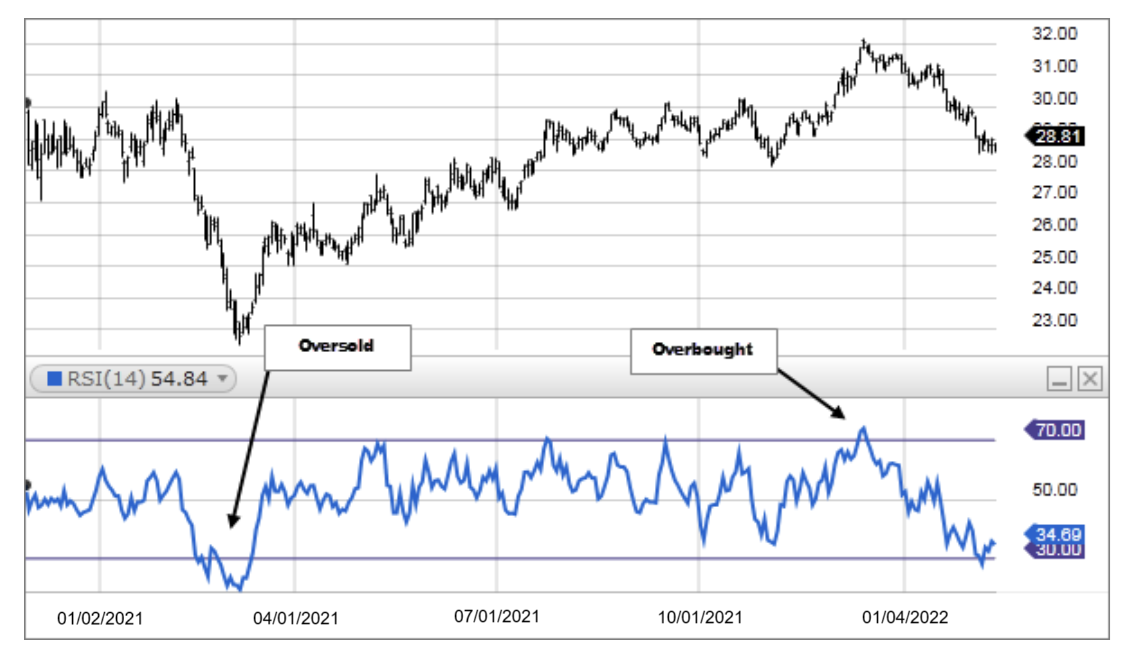
- RSI is considered overbought when above 70 and oversold when below 30. These traditional levels can also be adjusted if necessary to better fit the security. For example, if a security is repeatedly reaching the overbought level of 70 you may want to adjust this level to 80.
Note: During strong trends, the RSI may remain in overbought or oversold for extended periods.
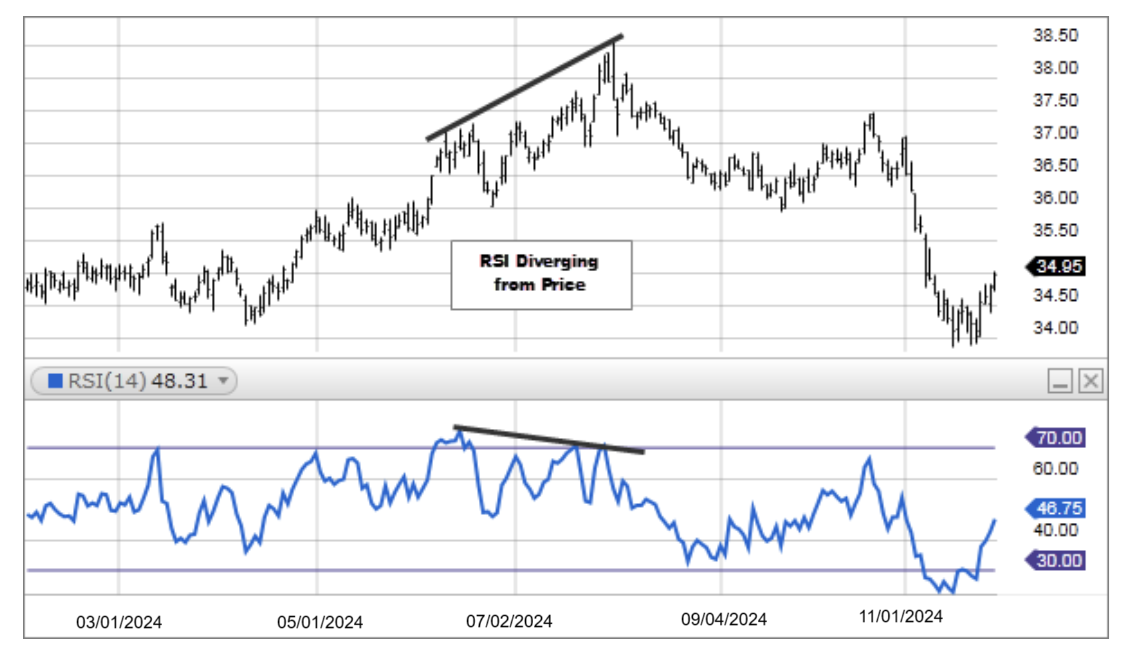
- RSI also often forms chart patterns that may not show on the underlying price chart, such as double tops and bottoms and trend lines. Also, look for support or resistance on the RSI.
- In an uptrend or bull market, the RSI tends to remain in the 40 to 90 range with the 40-50 zone acting as support. During a downtrend or bear market the RSI tends to stay between the 10 to 60 range with the 50-60 zone acting as resistance. These ranges will vary depending on the RSI settings and the strength of the security’s or market’s underlying trend.
- If underlying prices make a new high or low that isn't confirmed by the RSI, this divergence can signal a price reversal. If the RSI makes a lower high and then follows with a downside move below a previous low, a Top Swing Failure has occurred. If the RSI makes a higher low and then follows with an upside move above a previous high, a Bottom Swing Failure has occurred.
The RSI is a fairly simple formula, but is difficult to explain without pages of examples. Refer to Wilder's book for additional calculation information. The basic formula is:
RSI = 100 – [100 / ( 1 + (Average of Upward Price Change / Average of Downward Price Change ) ) ]