- Dow Theory is a chart pattern that can confirm uptrends or downtrends for stocks.
- This indicator currently suggests stocks can push to new highs.
The Dow Jones Industrial Average—which represents 30 of the biggest and most influential US companies—has gained roughly 5% year to date on a price return basis, as of mid-July. But it's been a volatile ride to get to this point. With markets near all-time highs, can the rally continue? Dow Theory suggests it can.
What is Dow Theory?
Dow Theory is the foundation of technical analysis—finding patterns and trends, mostly in charts, based on market behavior and investor psychology. It was created by Charles Dow, cofounder of The Wall Street Journal and the Dow Jones Industrial Average.
Dow, who died in 1902, used the analogy of the ebb and flow of tides to describe how the market acts. He believed that stocks move in trends, similar to how waves crash onto the beach, and leave patterns in the sand to show where high and low tides occurred.
Dow Theory is based on 2 indexes: Industrials and Transports. Here are the key tenets of Dow Theory:
- The averages discount everything (i.e., they reflect all relevant market information).
- The market moves in waves and trends, and a trend is assumed to exist until evidence suggests it has reversed.
- Volume must confirm the trend.
If there is one critical application of Dow Theory to know about, it is that the averages (the Dow Jones Industrial Index and the Dow Jones Transportation Index) must confirm one another.
For example, suppose that during a bull market rally, the Transports made a new relative high (a price that is higher than the most recent data, which can be several weeks or months) as did the Industrials. This would be considered a confirmation of the uptrend.
Alternatively, suppose that the Transports made a new relative high but the Industrials did not. That the averages did not confirm one another (both did not make new relative highs at roughly the same time) may indicate that a reversal of the trend could be on the horizon.
Not only did Dow believe that the movements of the 2 averages must confirm each other, he also thought that volume for one or both averages must confirm the trend. For example, if a stock rises and volume rises (relative to a recent time frame, say, the past several weeks or months), that means volume has confirmed the uptrend. Similarly, if a stock declines and volume rises, that means volume has confirmed the downtrend. Dow assumed an existing trend to be in place until clear signals, confirmed by volume, indicated that it has reversed.
Dow Theory now says...
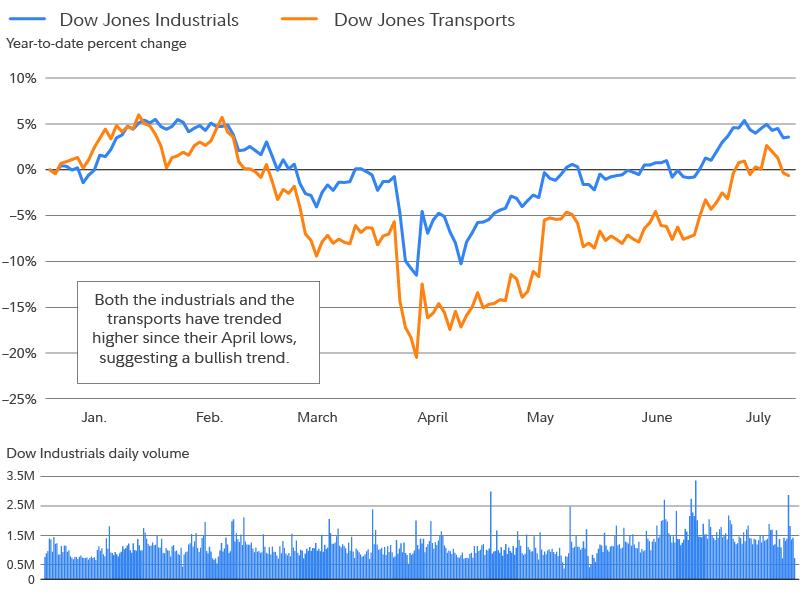
Stocks have rebounded from their spring lows to trade near record highs. Both the Industrials and the Transports have trended up since their April lows and have been making higher highs, suggesting a confirmation of the bullish trend.

In terms of volume, it has generally been marginally lower than prior months. Of course, that is often a seasonal effect, where volume tends to diminish over the summer months. But it is roughly in line with volume trends from the same period last year. Active investors may want to watch volume trends to further confirm the signal given by the Industrials and Transports.
Dow Theory in context
Critics of Dow Theory (and of technical analysis in general) might say that prices alone are not sufficient information on which to base an investing decision. Additionally, Dow Theory relies on 2 indexes that have changed composition dramatically since the theory was created more than 100 years ago.
More importantly, signals given by Dow Theory and other indicators may be rendered irrelevant when powerful market events—like potential Fed moves, inflation trends, and geopolitical developments—overwhelm any value of assessing market psychology via charts.
That's why you might consider using Dow Theory in combination with other tools and methods, including fundamental analysis, to help identify trends and potential changes in trends. That said, Dow Theory suggests the market could test new highs.


