Estimate Time5 min

3 things you should know about recessions

Key takeaways

  • Not all recessions are the same.
  • Not all recessions have been bad for the stock market.
  • Investing during a recession isn't necessarily a bad idea.

Recessions are a natural part of the business cycle, and though they certainly bring a degree of uncertainty and volatility with them, it's important not to let fears of a short-term economic contraction lead you to take your eye off your long-term goals. (For more information about how and why recessions develop, read our article, What's a recession, and how does it work?)

Having a plan and remaining invested are 2 important drivers of long-term financial success. It's important to understand what could happen in a recession what that really means for investors. Here are 3 things you should know about recessions, so you can be prepared for what might be in store.

Insights from Fidelity Wealth Management

Get our exclusive Fidelity perspective with Insights from Fidelity Wealth ManagementSM


1. Stocks and bonds have historically experienced gains before a recession begins

"Some investors may avoid putting money into the market because they are afraid of a potential recession," says Naveen Malwal, an institutional portfolio manager with Strategic Advisers, LLC. "But that often doesn't work out, because markets have typically risen before a recession."

"We can look back to June 2022 as a recent example of this," says Malwal. "Back then, the S&P 500 index had entered a bear market, and news headlines started to point to rising risk of recession in the U.S. Yet the S&P 500 returned about 33% since June 16 of that year through the end of 2023.1 But some investors missed out on those gains. Looking back further, stocks experienced gains over the 12 months prior to the 2008 and 2020 recessions as well."2

2. Not all recessions are the same

For many investors, the difficulties of the recession that accompanied the 2008 financial crisis loom large in their memories. In reality, that was something of an outlier. Generally speaking, recessions have historically been infrequent and short-lived.

"It's human nature to remember the more recent recessions as typical," says Malwal. "But some recessions have been brief or mild, as stocks experienced gains through those recessions. So presuming that every recession will lead to a deep market correction may lead investors to miss out on long-term gains."

Since 1950, the US economy has experienced 11 recessions. The average length of a recession is 11 months, with the longest lasting 19 months and the shortest only 3.3

What happens to the stock market in a recession isn't so cut and dry, either. Perhaps counterintuitively, 5 of the 11 recessions we've had since 1950 led to positive stock market returns.3

Between 1950 and 2022, 5 of the last 11 recessions have led to positive total returns for the S&P 500 index.
Past performance is no guarantee of future results. Source: Bloomberg Finance, LP. from 1950-2023. Indexes are unmanaged. It is not possible to invest directly in an index.

Generally, stocks have grown more than they've contracted, and when juxtaposed with the long expansionary periods we've seen in the market, the recessions look much less daunting. "Stocks have more typically experienced longer, lasting expansions," says Malwal, "which have more than made up for the relatively short bouts of volatility that investors have experienced during recessions."

Market returns since 1950 on average have been positive, including dividends. Additionally, over this time span, the market has been in an expansionary period the vast majority of the time.
This chart illustrates the cumulative percentage return of a hypothetical investment made in the noted index during periods of economic expansions and recessions. Index returns include reinvestment of capital gains and dividends, if any, but do not reflect any fees or expenses. This chart is not intended to imply any future performance of the investment product. Past performance is no guarantee of future results. It is not possible to invest directly in an index. All indexes are unmanaged. Please see disclosures for important index information. Source: Bloomberg, S&P 500 Index total return for 1/1/50 to 12/31/23; recession and expansion dates defined by the National Bureau of Economic Research (NBER).

Market recoveries can be swift and unexpected and can begin even when what you're reading in the news seems the most dire. Trying to time the markets or jumping in and out of your investment plan in the hopes of mitigating losses or taking advantage of the dip may be more disruptive than the recession itself and could result in missing out on future gains.

"News headlines can make it very hard to get back into the market as it is recovering after a recession," says Malwal. "For example, a lot of investors were nervous to invest once the US entered a recession in 2020. News headlines about the pandemic, high unemployment, and corporate profit declines persisted throughout the year. Yet, stocks rallied about 70% from March 23 through December 31, 2020. It was similar after 2008: In 2009, stocks rallied about 68% from March 9 through December 31 of that year."4

On average, the total return for the S&P 500® index in the 12 months after the market found its bottom during a recession is 38%.5

An investment of $10,000 in the S&P 500<sup>®</sup> Index in 1980 would have grown to $1,261,404 by 2021. Missing out on even five of the best days over that period would have greatly reduced the portfolio's value.
Past performance is not a guarantee of future results. Measures the 50 best one-day returns of the S&P 500 Index from 01/01/1980 to 12/31/2023 as of 12/31/2023. A bear market is defined as a 20% drop in the S&P 500 Index from a previous high. It is not possible to invest directly in an index. All indexes are unmanaged.

3. Investing during a recession isn't necessarily a bad idea

Our research shows that when you invest—that is, which stage of the business cycle you choose to put your money in the market—may have very little effect on the average, long-term performance of your portfolio. This means that making investment decisions based on where you think the US economy is in its business cycle isn't likely to have a dramatic effect on long-term outcomes.

Looking at the 20-year expected portfolio returns starting in each cycle, both the range of expected returns and the average expected returns show little variance.
*Real return is the total return of an investment less the rate of inflation. For illustrative purposes only. Past performance is no guarantee of future results. It is not possible to invest directly in an index. All indexes are unmanaged. Sample Portfolio: 36% Domestic Equity, 24% Foreign Equity, 40% IG Bonds. See disclosures for index information. This historical analysis is based on Monte Carlo analysis based on historical index returns. Range of expected returns illustrates simulations between the 25th and 75th percentile. The simulations represent an 85% confidence interval. Actual returns could potentially be higher or lower. Portfolio based on Dow Jones U.S. Total Stock Market Index, MSCI ACWI ex-US Index, Bloomberg Aggregate Index, as of 12/31/23.

The truth is, when we look at historical trends, economic events such as recessions can be less damaging to the long-term growth of your portfolio than allowing fear and uncertainty to cloud your judgment. Many of the most natural reactions—such as wanting to get out of the market or getting more conservative with your portfolio—may lead to poorer long-term performance.
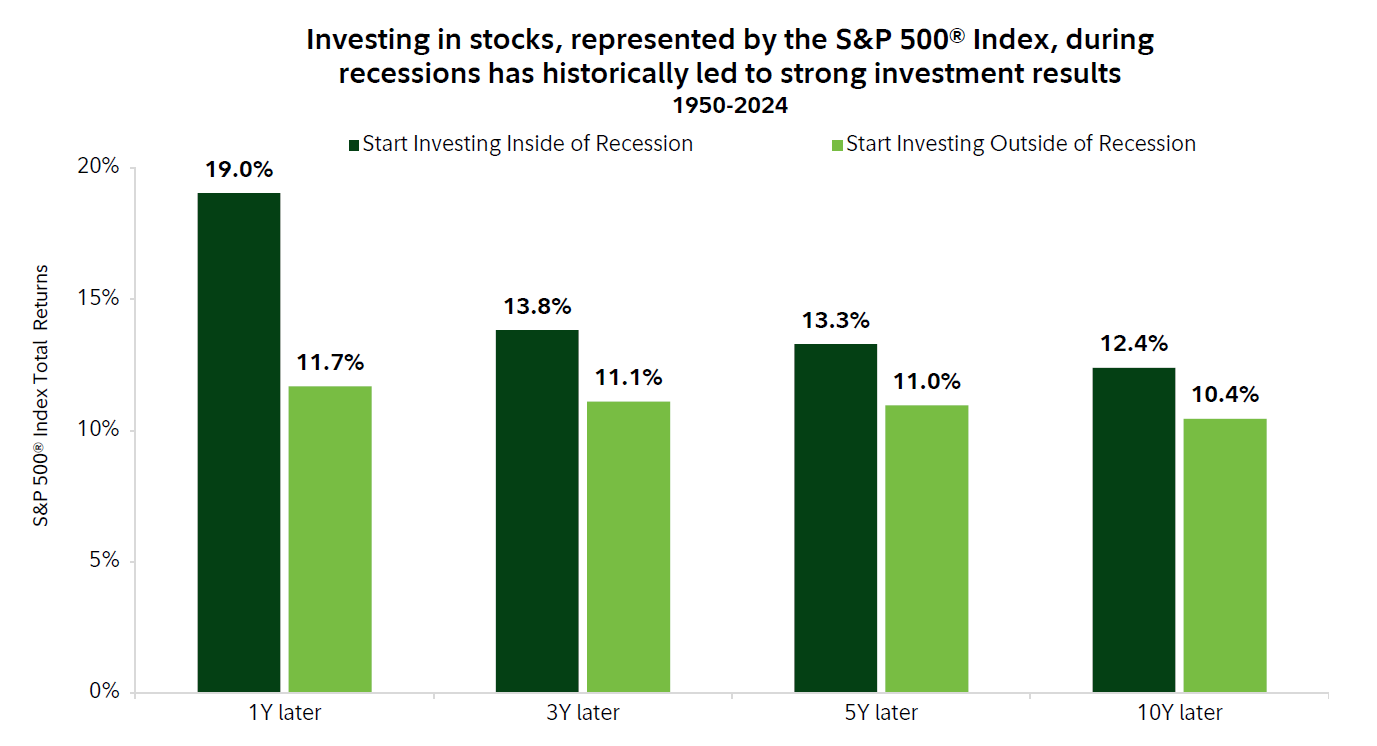
A disciplined approach may lead to rewards during a recession

Remaining disciplined and sticking to your long-term investment plan may be a more reliable way to achieve your long-term financial goals than making significant changes in an attempt to avoid the short-term pain a recession might bring. We understand that when markets fall, it can be stressful to watch your investments lose value and tempting to abandon your strategy in an effort to stem the decline.

That's why it's important to prepare yourself and your portfolio to withstand that stress, by recognizing and coping with the built-in biases that compel us to make emotional decisions in periods of volatility, maintaining a well-diversified portfolio that can help mitigate the risks we're exposed to, and creating a strong financial foundation that helps us feel secure when confronted with uncertainty in the market.

Start a conversation

Already working 1-on-1 with us?
Schedule an appointmentLog In Required

More to explore

1.  Source: Bloomberg Finance, S&P 500 index total return 6/16/22-12/31/23 2. S&P 500® total returns (includes reinvestment of dividends and interest). The S&P 500® Index is a market capitalization-weighted index of 500 common stocks chosen for market size, liquidity, and industry group representation to represent US equity performance. It is not possible to invest in an index. 3. Source: National Bureau of Economic Research (NBER) recession dates and monthly S&P 500 total returns over the periods 1950-2023 4. S&P 500® total returns (includes reinvestment of dividends and interest). The S&P 500® Index is a market capitalization-weighted index of 500 common stocks chosen for market size, liquidity, and industry group representation to represent US equity performance. It is not possible to invest in an index. 5. Source: National Bureau of Economic Research (NBER) recession dates and monthly S&P 500 total returns over the periods 1950-2023

Investing involves risk, including risk of loss.

Past performance is no guarantee of future results.

This information is intended to be educational and is not tailored to the investment needs of any specific investor.

Indexes are unmanaged. It is not possible to invest directly in an index.

Diversification and asset allocation do not ensure a profit or guarantee against loss.

The S&P 500® Index is a market capitalization–weighted index of 500 common stocks chosen for market size, liquidity, and industry group representation to represent U.S. equity performance. The Dow Jones U.S. Total Stock Market Index is an all-inclusive measure composed of all U.S. equity securities with readily available prices. This broad index is sliced according to stock-size segment, style, and sector to create distinct sub-indexes that track every major segment of the market. The MSCI All Country World Ex-U.S. Index (Net MA) is a market capitalization–weighted index designed to measure the investable equity market performance for global investors of large- and mid-cap stocks in developed and emerging markets, excluding the United States. The Bloomberg U.S. Aggregate Bond Index is a broad-based flagship benchmark that measures the investment-grade, U.S. dollar–denominated, fixed-rate taxable bond market. The index includes Treasuries, government-related and corporate securities, mortgage-back securities (agency fixed-rate pass-throughs), asset-backed securities, and collateralized mortgage-backed securities (agency and non-agency).

Stock markets are volatile and can fluctuate significantly in response to company, industry, political, regulatory, market, or economic developments. Investing in stock involves risks, including the loss of principal.

Views expressed are as of the date indicated, based on the information available at that time, and may change based on market or other conditions. Unless otherwise noted, the opinions provided are those of the speaker or author and not necessarily those of Fidelity Investments or its affiliates. Fidelity does not assume any duty to update any of the information.

Fidelity Brokerage Services LLC, Member NYSE, SIPC, 900 Salem Street, Smithfield, RI 02917

892905.21.0