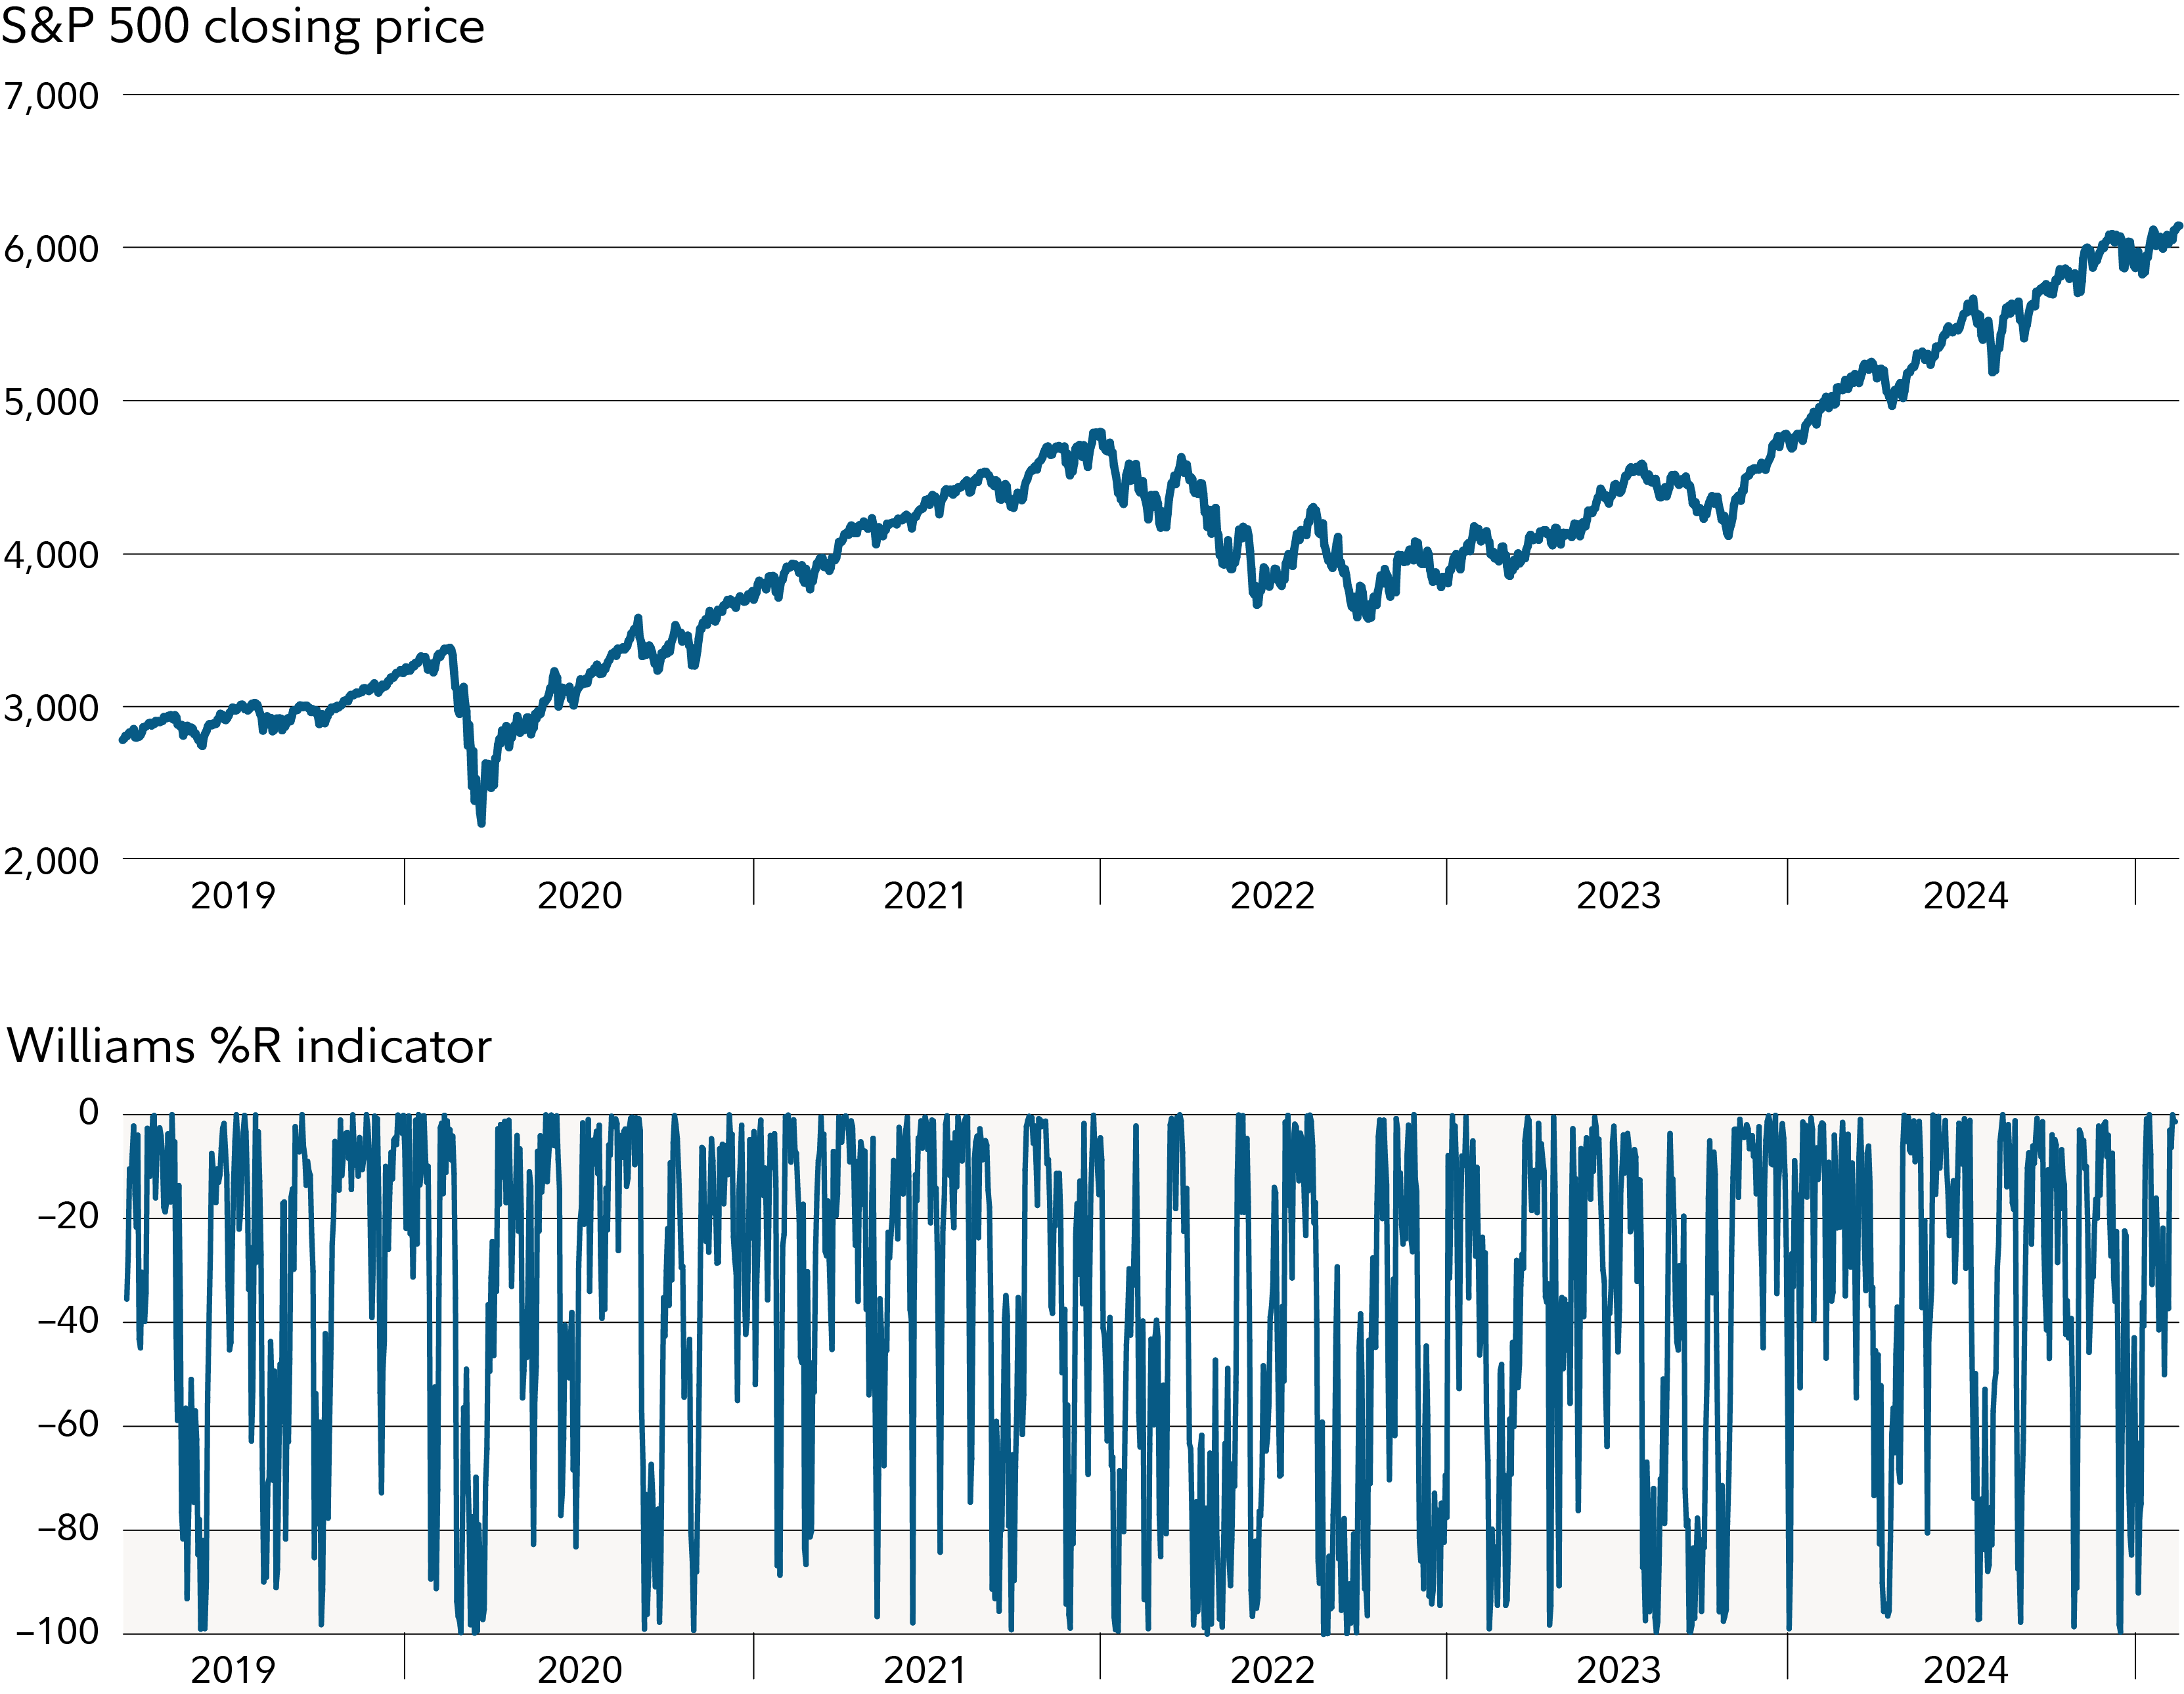
The "yeah, but..." market soldiers on. Despite tariff wars, seemingly implacable inflation, and other factors that might otherwise stop the bull market in its tracks, the S&P made another all-time high this past week. Investors have generally responded to these market risks with a "yeah, but..." response, citing expectation-beating earnings, momentum, and more.
What do the charts say? Investors that use chart analysis might find the Williams %R technical indicator is nearing a sell signal.
What is Williams %R?
While not as widely used as other indicators such as moving averages, MACD, RSI, stochastics, and other technicals, Williams %R has many similarities to those—especially stochastics. Williams %R measures the price of an investment or index relative to the highest high for a given period of time. Essentially, it compares the last closing price to the highest price during a period of time. In contrast, stochastics compares the last closing price to the lowest price during a period of time.
Williams %R is a momentum oscillator that ranges between 0 and –100. Essentially, readings between 0 and –20 are considered sell signals and those from –80 to –100 are considered buy signals. Additionally, a cross above the –50 level is considered a bullish signal and a cross below –50 is considered a bearish signal.
The top part of the following chart shows how stocks have been in a long-term uptrend. The bottom part shows what the Williams %R indicator looks like (you can select Williams %R in Active Trader Pro® under the “indicators” dropdown menu).

Recently, Williams %R ticked in near 0. Because it is between 0 and -20, this indicator is registering a short-term sell signal. The last cross above the -50 mark was back in mid-January, when Williams %R crossed above that midpoint (a bullish signal).
It’s worth noting that oscillators—including Williams %R—can remain in what is considered overbought or oversold ranges for extended periods of time.
The bigger picture
Of course, indicators like Williams %R should never be used in isolation to help you make trading decisions. It can be used in combination with other technical and fundamental data points to help form your outlook on an individual stock and on the overall stock market.


