
Description
Developed by Larry Williams, Williams %R is a momentum indicator that is the inverse of the Fast Stochastic Oscillator. Readings from 0 to -20 are considered overbought. Readings from -80 to -100 are considered oversold. Williams %R reflects the level of the close relative to the highest high for the look-back period. This is a bound oscillator and oscillates from 0 to -100. As a result, the Fast Stochastic Oscillator and Williams %R produce the exact same lines, only the scaling is different. Williams %R corrects for the inversion by multiplying the raw value by -100.
- Williams %R moves between 0 and -100, which makes -50 the midpoint. A Williams %R cross above -50 signals that prices are trading in the upper half of their high-low range for the given look-back period (Bullish). Conversely, a cross below -50 means prices are trading in the bottom half of the given look-back period (Bearish).
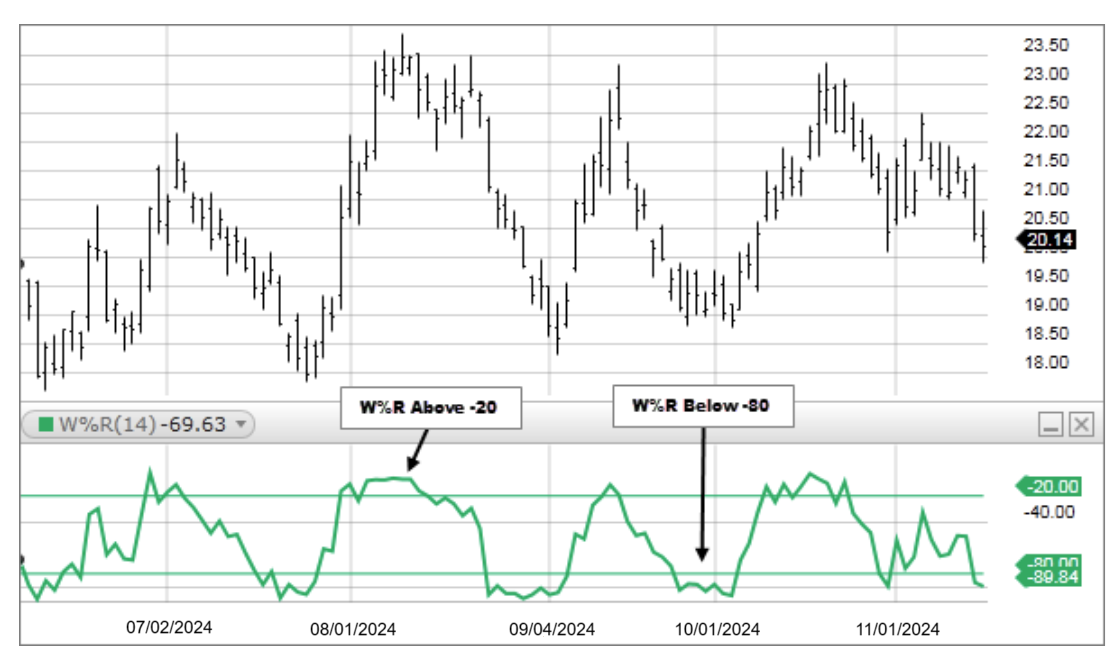
- Readings above -20 for the 14-day Williams %R would indicate that the underlying security was trading near the top of its 14-day high-low range. Readings below -80 occur when a security is trading at the low end of its high-low range. Default settings use -20 as the overbought threshold and -80 as the oversold threshold. These levels can be adjusted depending on the security’s characteristics. Note: Keep in mind that even though a security is overbought or oversold it can remain in this state for an extended period of time. When using any indicator it is best to use an additional indicator to confirm any signals.
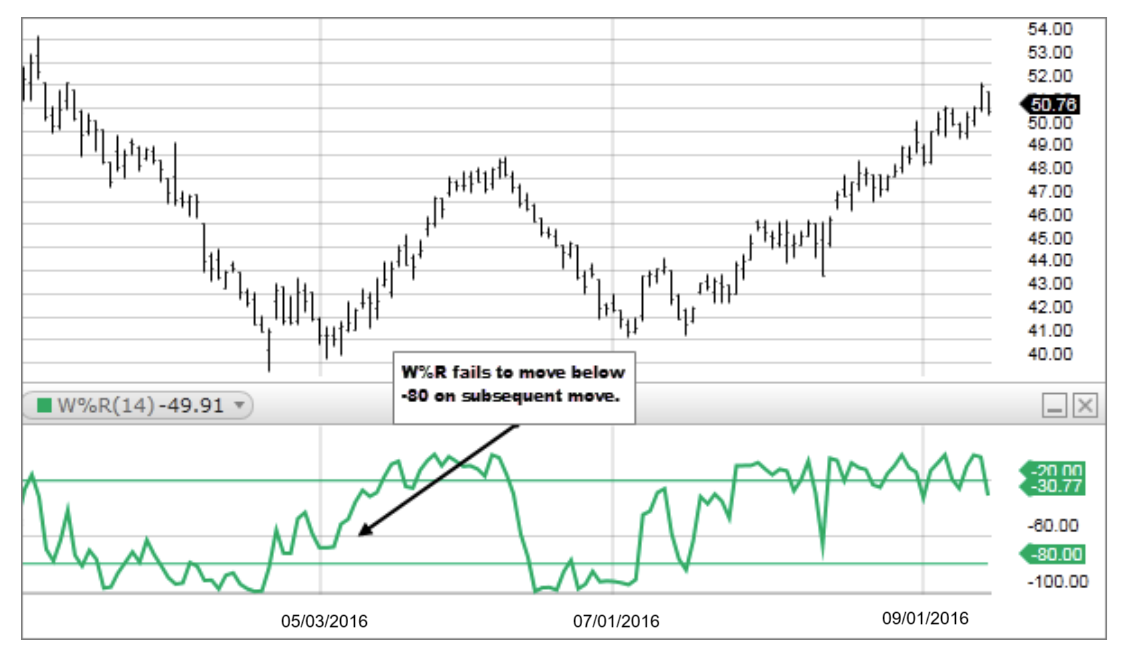
- When Williams % R moves above -20 and then, in the next move up, fails to move above -20, this can indicate weakening momentum to the upside. Conversely, when Williams % R moves below -80 and then, in the next move down, fails to move below -80, this can indicate weakening momentum to the downside.
The formula used to calculate Williams' %R is similar to the Stochastic Oscillator:

Note: It is also common to multiply the above formula by -1, which is an exact inverse. Both are acceptable calculations for this indicator.