


Investors can’t get enough of ETFs. 2026 is shaping up to be, by far, the biggest year for annual ETF flows yet. With roughly $1.013 billion in flows at the halfway point—which already marks the third consecutive year that ETF flows have topped $1 billion—some lofty records are now possible for the industry. Here’s where the momentum has been within ETFs.
Biggest year ever for ETF flows?
To put the first half in perspective, ETFs hauled in $1.5 trillion in flows during all of 2025.1 The more than $1 trillion in flows thus far this year represents an 87% increase over the first half of 2025, placing ETFs well ahead of last year’s record-breaking annual pace.
Q2 set the all-time record for a single quarter for total flows of over $550 billion. That was largely thanks to near-quarterly-record flows for passive ETFs as well as record quarterly active flows (more on this later). June ETF flows alone totaled $191 billion, which was the second-best month on record (trailing only December 2025’s record-breaking single month cume of $256 billion).
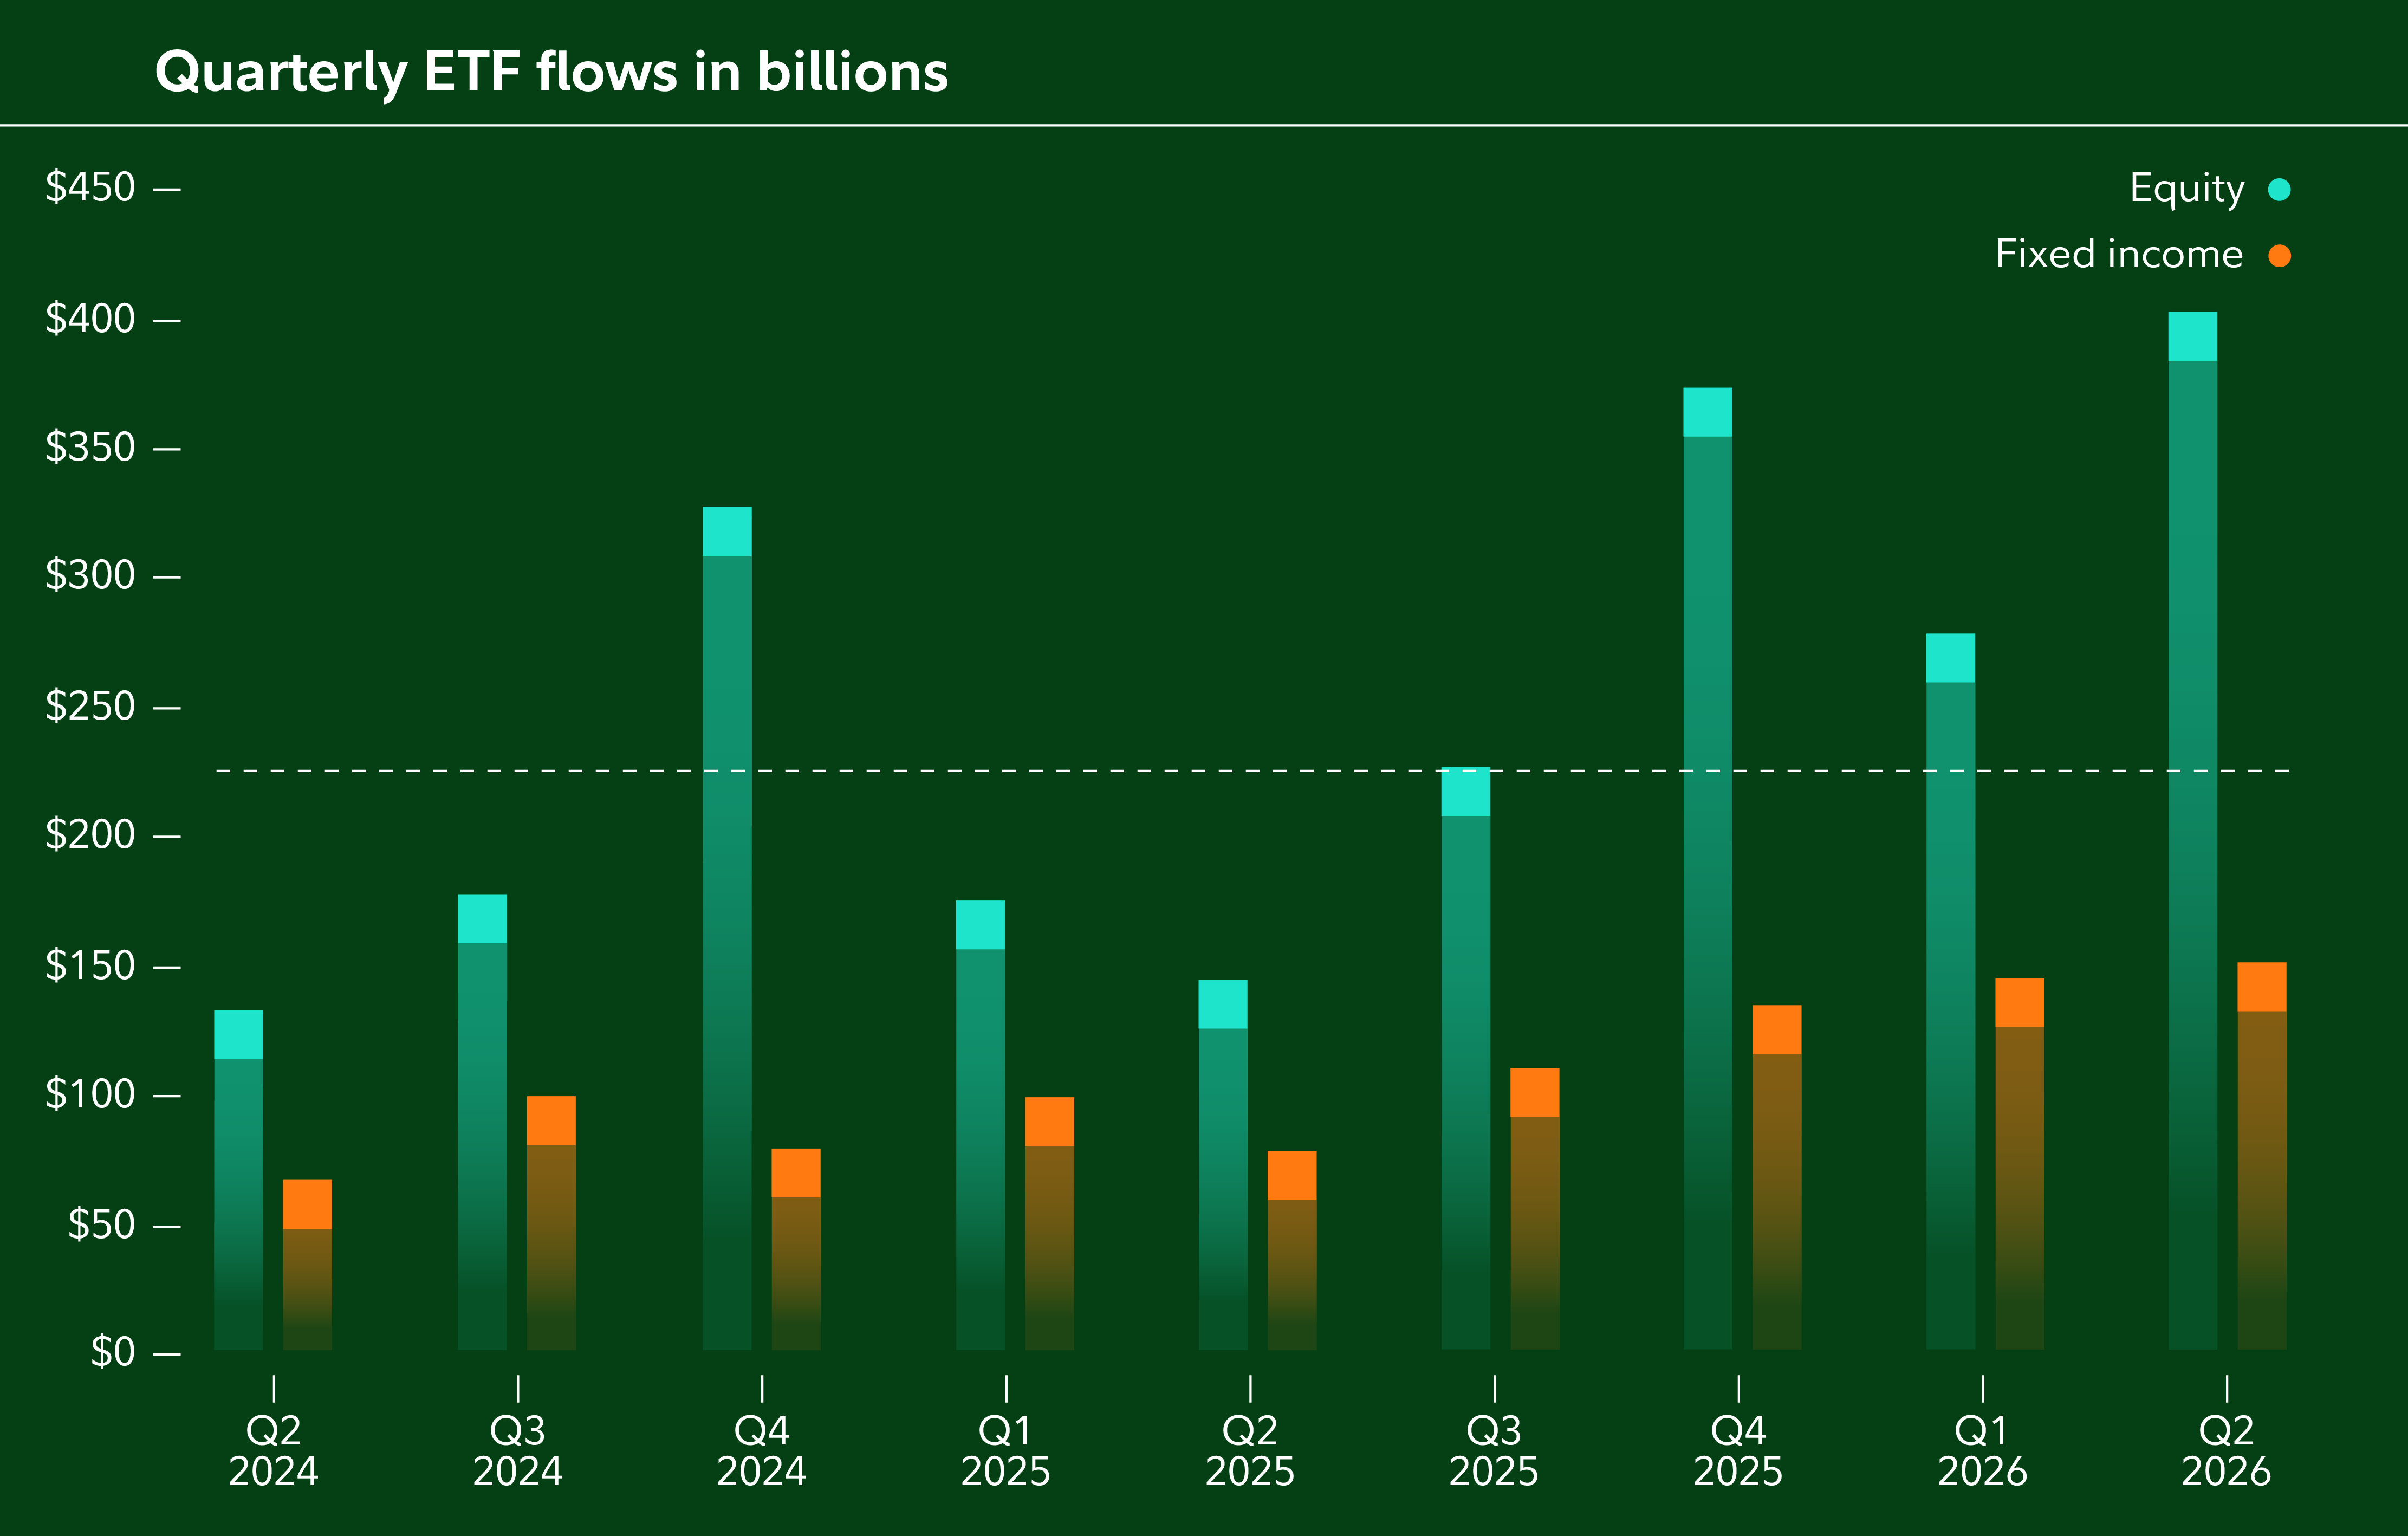
Equity (e.g., stock) ETF flows once again outpaced fixed income (e.g., bond) flows during both Q1 and Q2. But both set quarterly records in Q2. Equity flows surpassed $400 billion, while fixed income ETFs (which had their best year ever in 2025 with $426 billion of flows thanks to heavy demand for aggregate and government fixed income ETFs) topped $150 billion and are also on pace to shatter their annual record, having already accumulated roughly $300 billion in flows.
Tech flows lead again
The long-term trend among sector-themed flows has been tech attracting the most attention by far—despite some underlying volatility with the sector. Indeed, tech-themed ETFs gathered more flows than all other sectors combined.
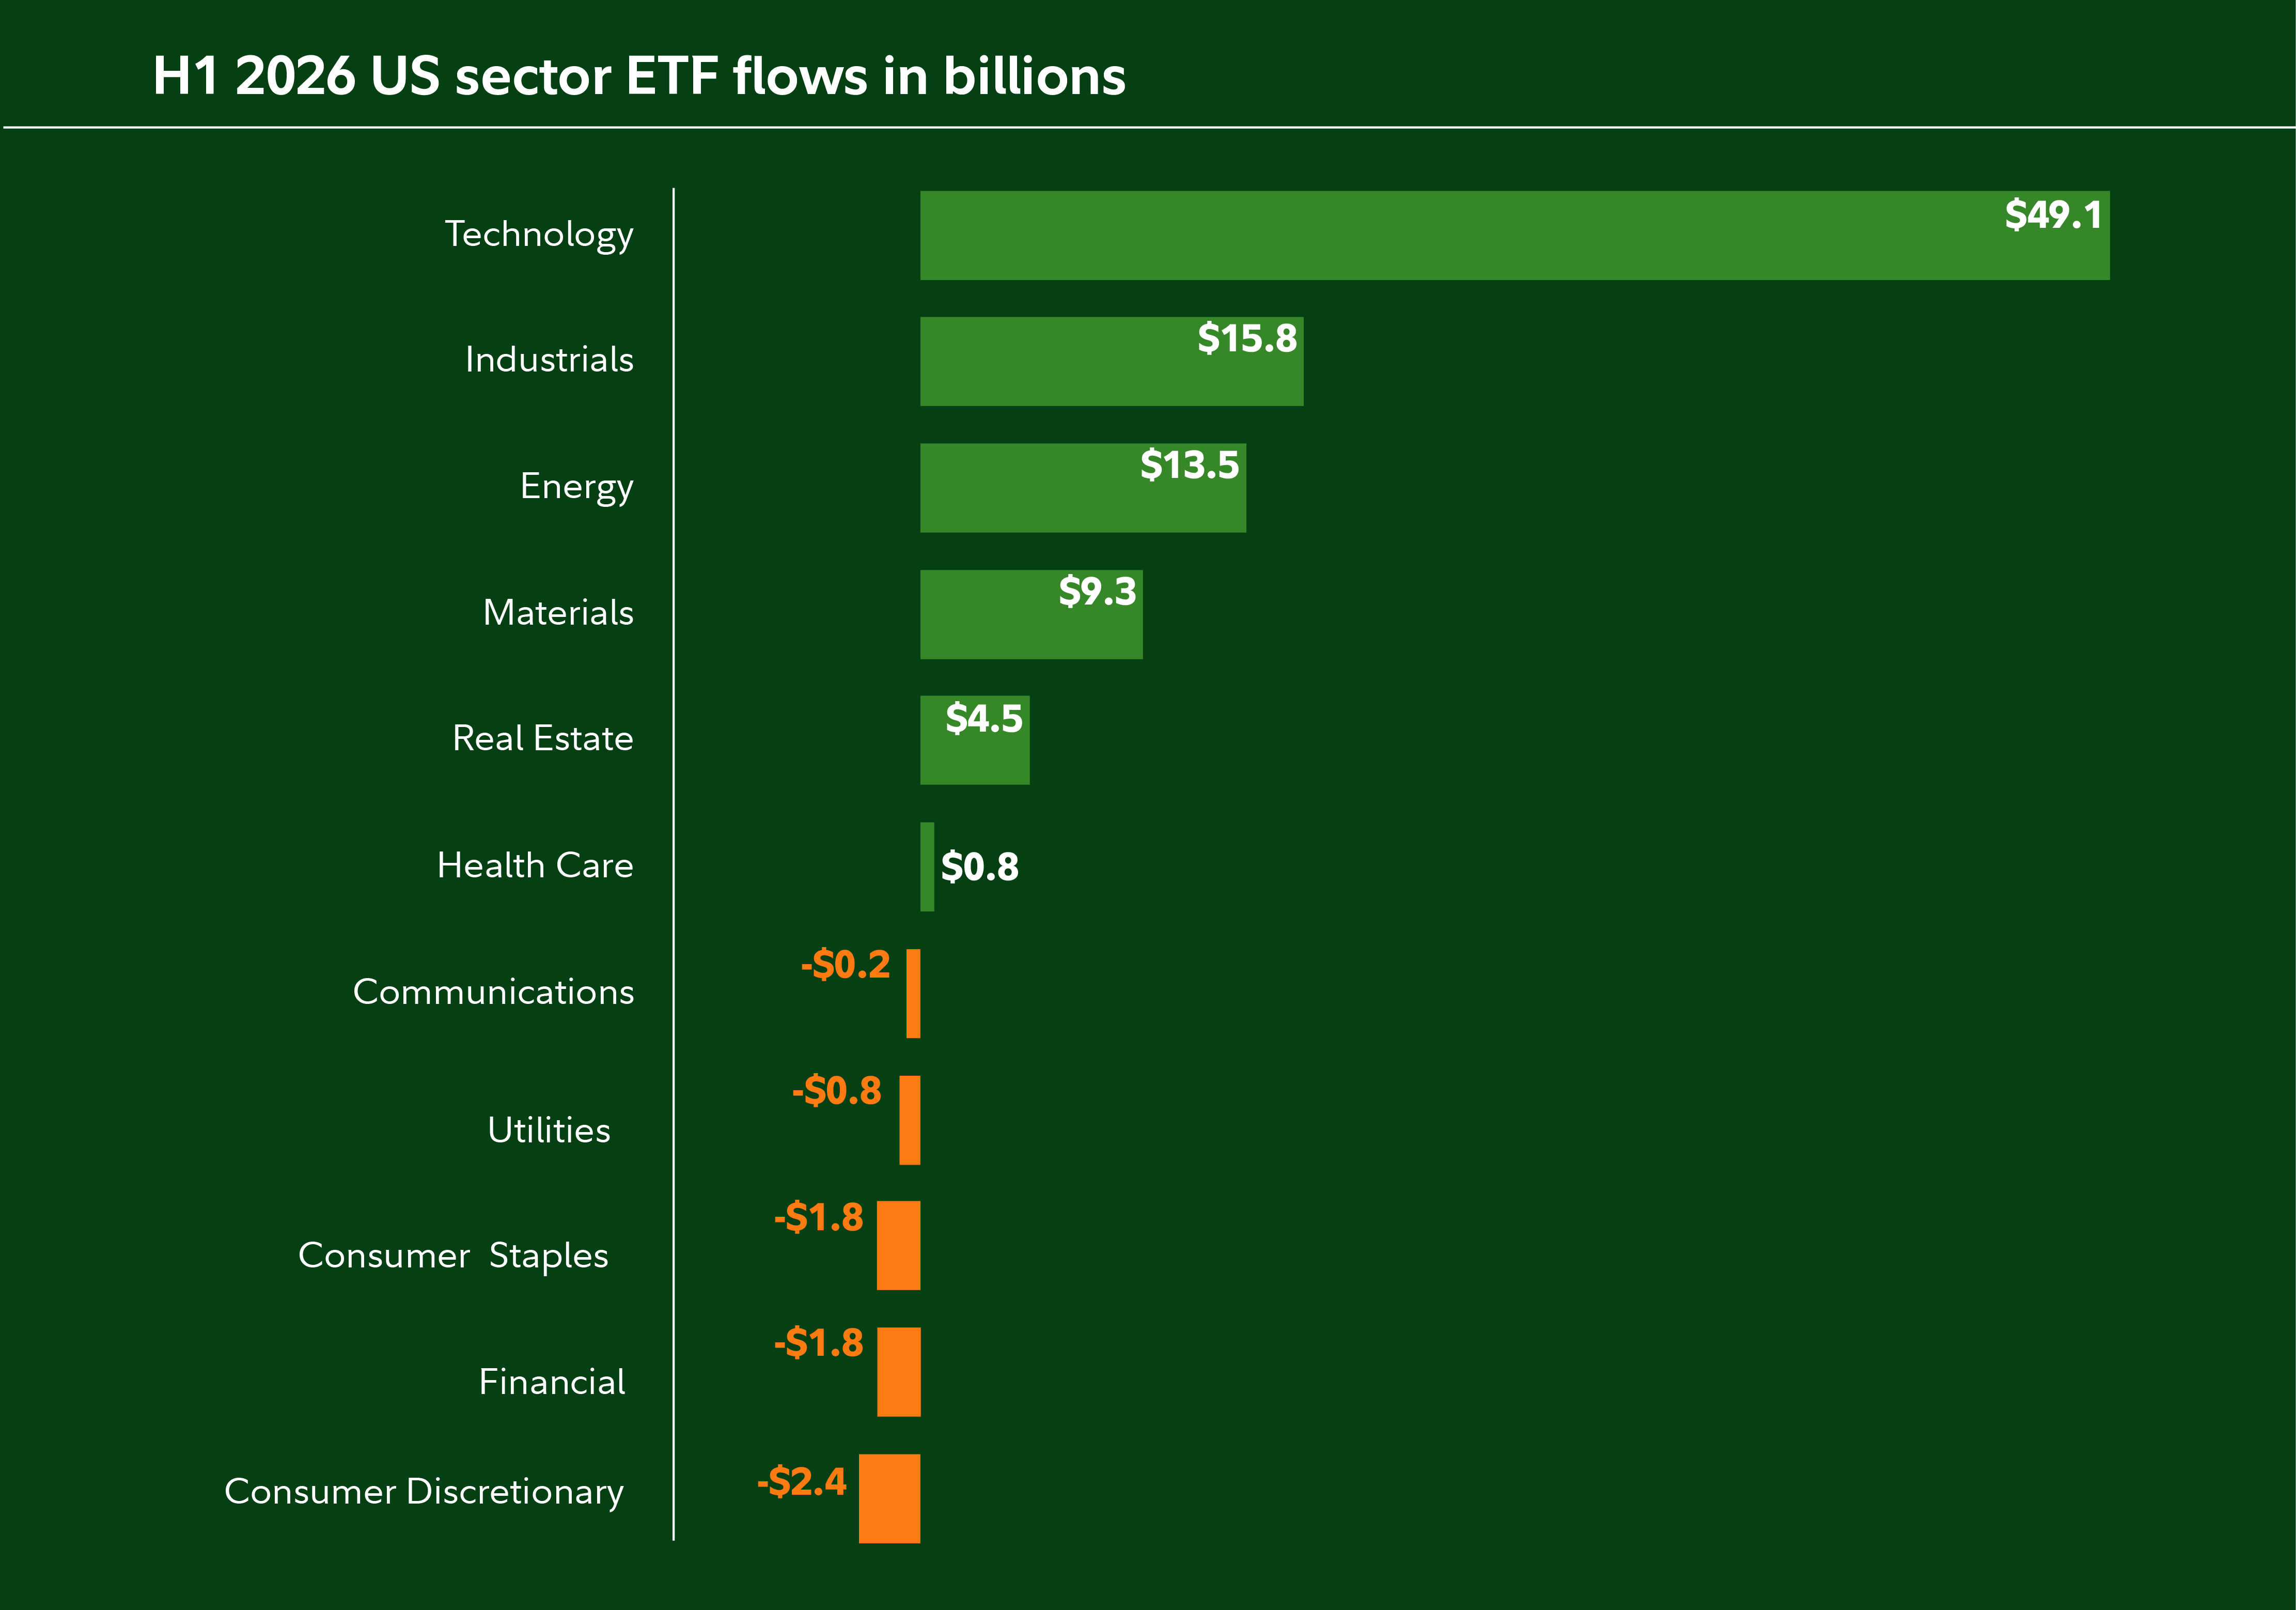
Industrials, energy, and materials were the other sectors at the top of the leaderboard, while consumer discretionary, financial, consumer staples, utilities, and communication services experienced outflows.
Investors may want to monitor if the momentum persists for technology-themed ETF flows, given the recent volatility in the AI and tech trade.
Active ETF growth
Bolstered by a steady increase in offerings and growing industry demand, actively managed ETF flows had their best half ever. Active ETFs, which in contrast to passively managed ETFs are not designed to track a benchmark, brought in roughly $350 billion in flows during the first half—including nearly $200 billion during Q2. That’s the highest total for that category on record.
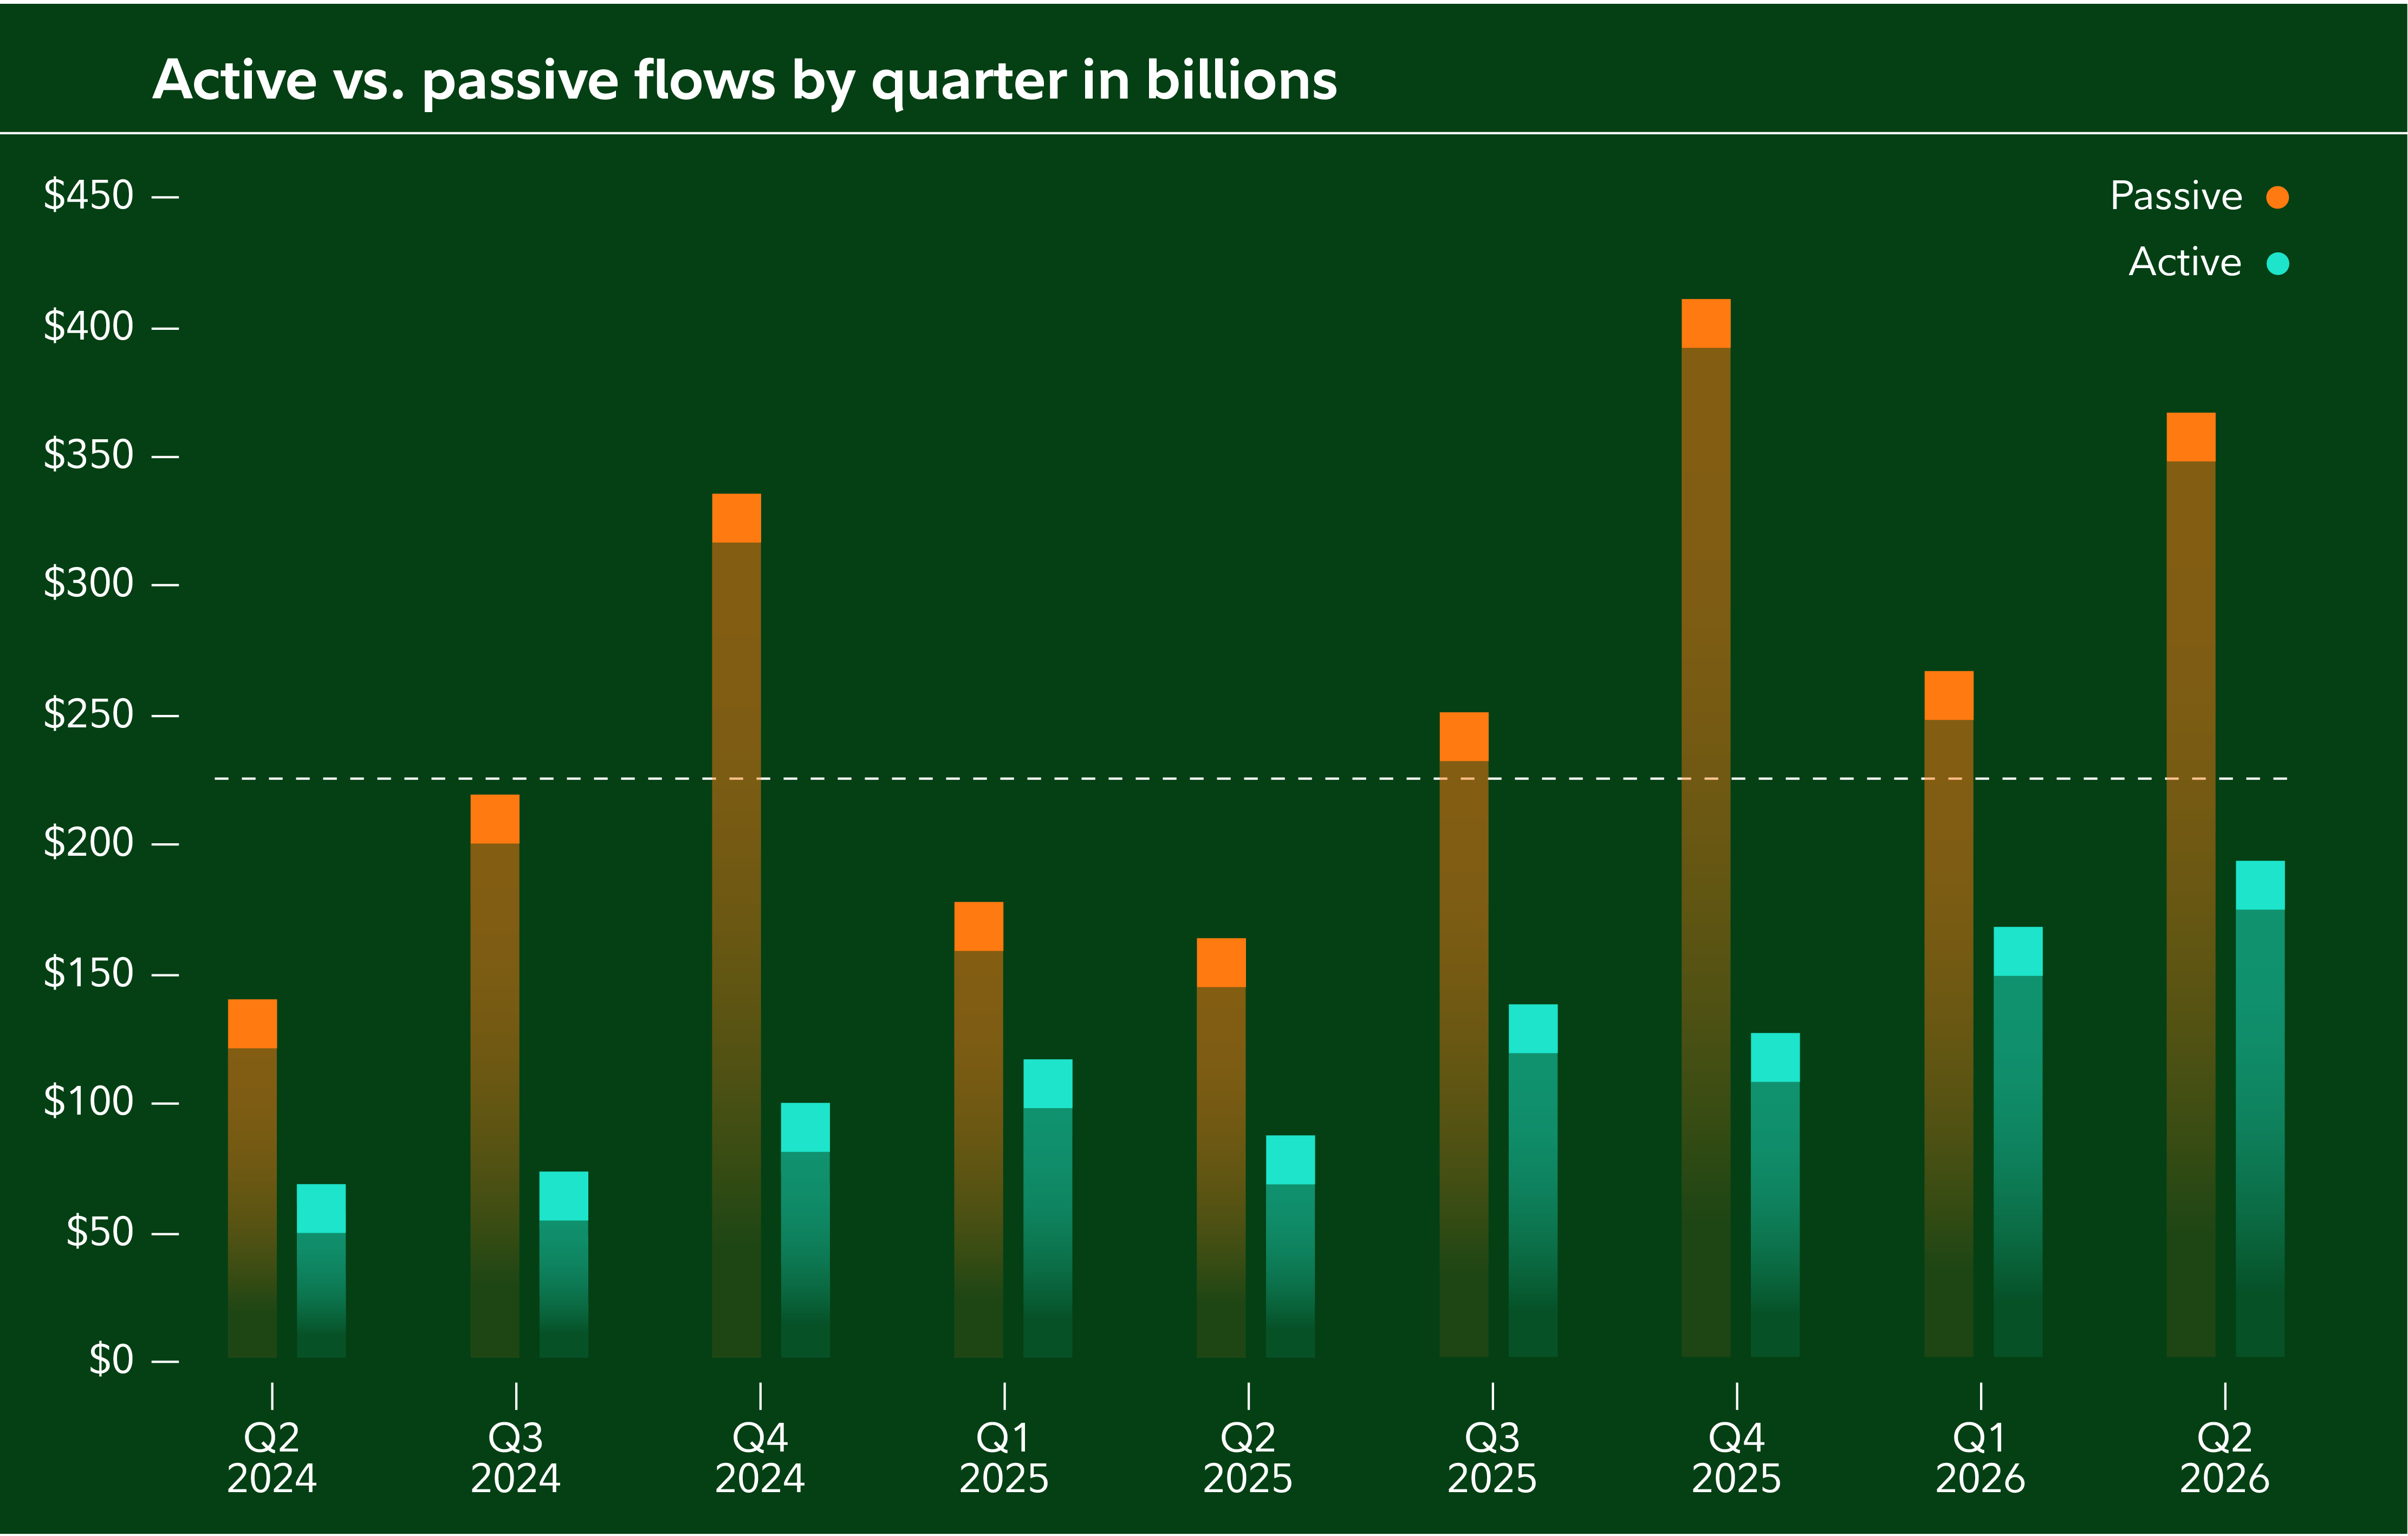
With that said, passively managed ETF flows continue to dominate actively managed ETF flows, with 2 of the last 3 quarters being the highest on record for the former. And the gap between the 2 categories, which had narrowed for most of 2025, has widened once again over the past several quarters.
Looking for ETFs?
ETF flows can be a useful tool to help identify market trends, and to see where investors are broadly putting their money. If you are interested in investing in ETFs, Fidelity's ETF Screener can quickly sort through a lot of data based on the filtering selections you make.
You can search for ETFs using a variety of characteristics, like the fund's objectives, fundamentals, technicals, performance, volatility, trading characteristics, tax considerations, and analyst ratings.