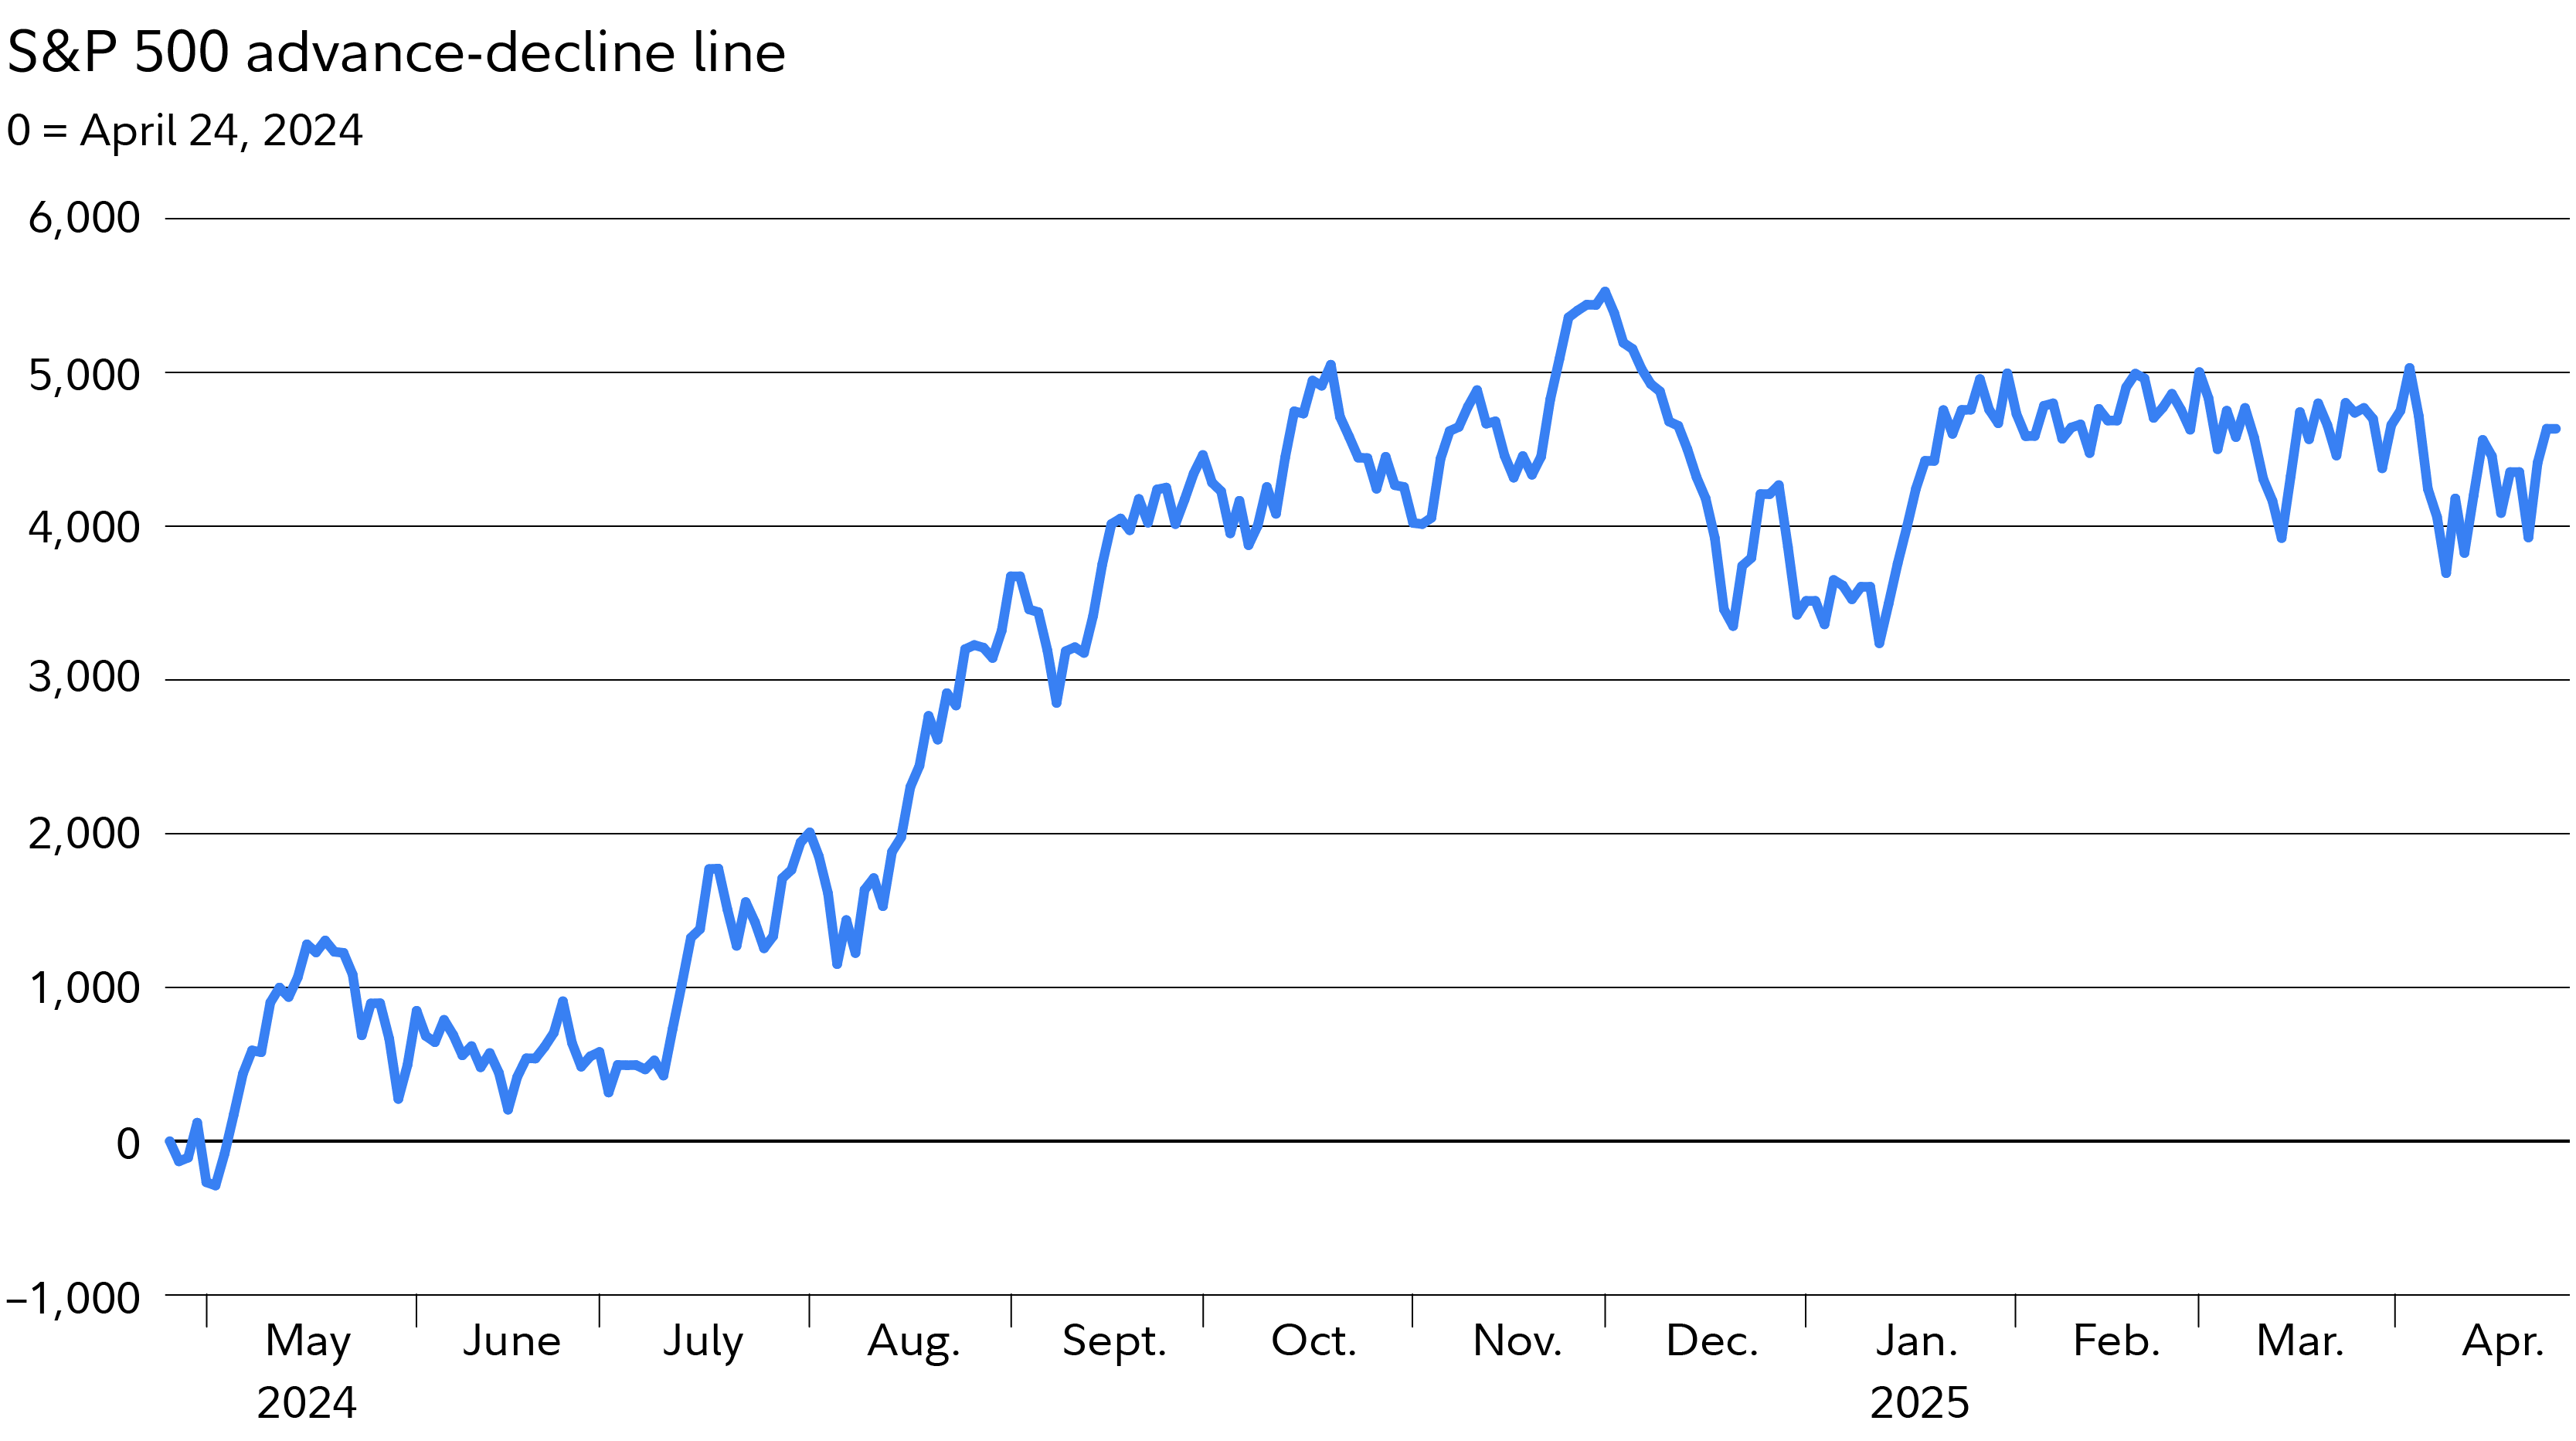
What a ride it's been for stocks lately. If you've been watching the S&P 500, you know just how big some of the price swings have been. Chart users have also been taking notice of some sizeable shifts in market breadth, based on advance/decline data—which suggests some bearish sentiment among stock investors.
How to use advance/decline
There are several variations of advance/decline data, but all attempt to answer the same question: Are investors generally bullish or bearish?
It’s a sentiment indicator that looks at the number of advancing stocks vs. the number of declining stocks. Chart users can utilize this information to help confirm trends or signal potential reversals. The advance/decline line takes the cumulative total of the number of stocks advancing less the number of stocks declining over some period of time.
Here are the key points to know:
- If stocks or an index are rising and the A/D line is also rising, more stocks are contributing to the rally and sentiment is thought to be broadly bullish.
- If stocks or an index are falling and the A/D line is also falling, fewer stocks are advancing during the downtrend and investor sentiment is thought to be broadly bearish.
- If stocks or an index are rising but the A/D line is falling, fewer stocks are contributing to the rally and that could signal a potential reversal of the uptrend. If stocks or an index are falling but the A/D line is rising, fewer stocks are declining and that could signal a potential reversal of the downtrend. Both of these situations are known as divergences.
You can look at the slope (or trend) of the advance/decline line and can compare it against the trend for stocks. Of course, these signals may not always confirm trends or forecast potential reversals, but investors can use them to broadly assess investor sentiment.
Advance/decline stocks
While last year was another great one for stocks, as the S&P 500 posted a greater-than 20% gain for the second consecutive year, a trend that caught some investors' attention was a noticeable lack of strong market breadth. Basically, a relatively small percentage of stocks (e.g., the Magnificent 7) were responsible for much of the gains. Indeed, market breadth plunged in the final months of 2024. Some investors viewed this lack of market breadth as a reason to doubt the strength of the rally.

That fear appears to have played out thus far in 2025. Since peaking in November 2024, the advance/decline line has generally trended lower (although it has largely moved sideways more recently, as investor uncertainty has grown alongside new tariff policies). At the same time, stocks are down sharply from their February highs and have lost nearly 7% year to date.
It’s also possible to look for divergences between an index’s value and the breadth indicator to signal a turning point. For example, if the S&P 500 made a higher high while the indicator made a lower high, this could suggest that the rally is weakening. Alternatively, if the S&P 500 made a lower low while the indicator made a higher low, that could suggest the downtrend is weakening. The S&P 500 has rebounded off its lows, but has yet to make a higher high. If it does (or it makes lower lows from here), you could monitor advance/decline action to confirm or not confirm the trend.
Charting investing sentiment
You can also look at advancing stocks vs. declining stocks as a ratio. This is the number of advancing stocks divided by the number of declining stocks. Generally, you can look at trends in the ratio to see if investor sentiment is becoming more bullish or bearish over a period of time. It's worth noting that the timeframe you select can have a meaningful impact on the output of this indicator. You may want to tailor the time period to more closely match your investing or trading horizon.
Indicators like advance/decline can be useful to help form your overall investing outlook. While there are additional market breadth indicators, like the ARMS index (which incorporates volume), 52-week high/low, and others, advance/decline may be the most widely used of them.
As tariffs and other factors help move markets, investor sentiment can be a valuable factor for you to consider. Even though stocks have bounced off their recent lows, the downtrend in the advance/decline line suggests market breadth may still be on the bearish side.


