After decades of saving, it's time to start spending once you enter retirement. But how much can you safely withdraw each year without needing to worry about running out of money? The answer is critical, as retirement can last 25 years or more these days, so you need a strategy that's built for the long haul.
A sustainable withdrawal rate
The sustainable withdrawal rate is the estimated percentage of savings you’re able to withdraw each year throughout retirement without running out of money.
We did the math—looking at history and simulating many potential outcomes—and landed on this: For a high degree of confidence that you can cover a consistent amount of expenses in retirement (i.e., it should work 90% of the time), aim to withdraw no more than 4% to 5% of your savings in the first year of retirement, and then adjust the amount every year for inflation.
Of course, your situation could be different. For example, you might want to withdraw more in the early years of retirement when you plan to travel extensively, and less in the later years. But this 4%-to-5% estimate offers a handy guideline for planning.
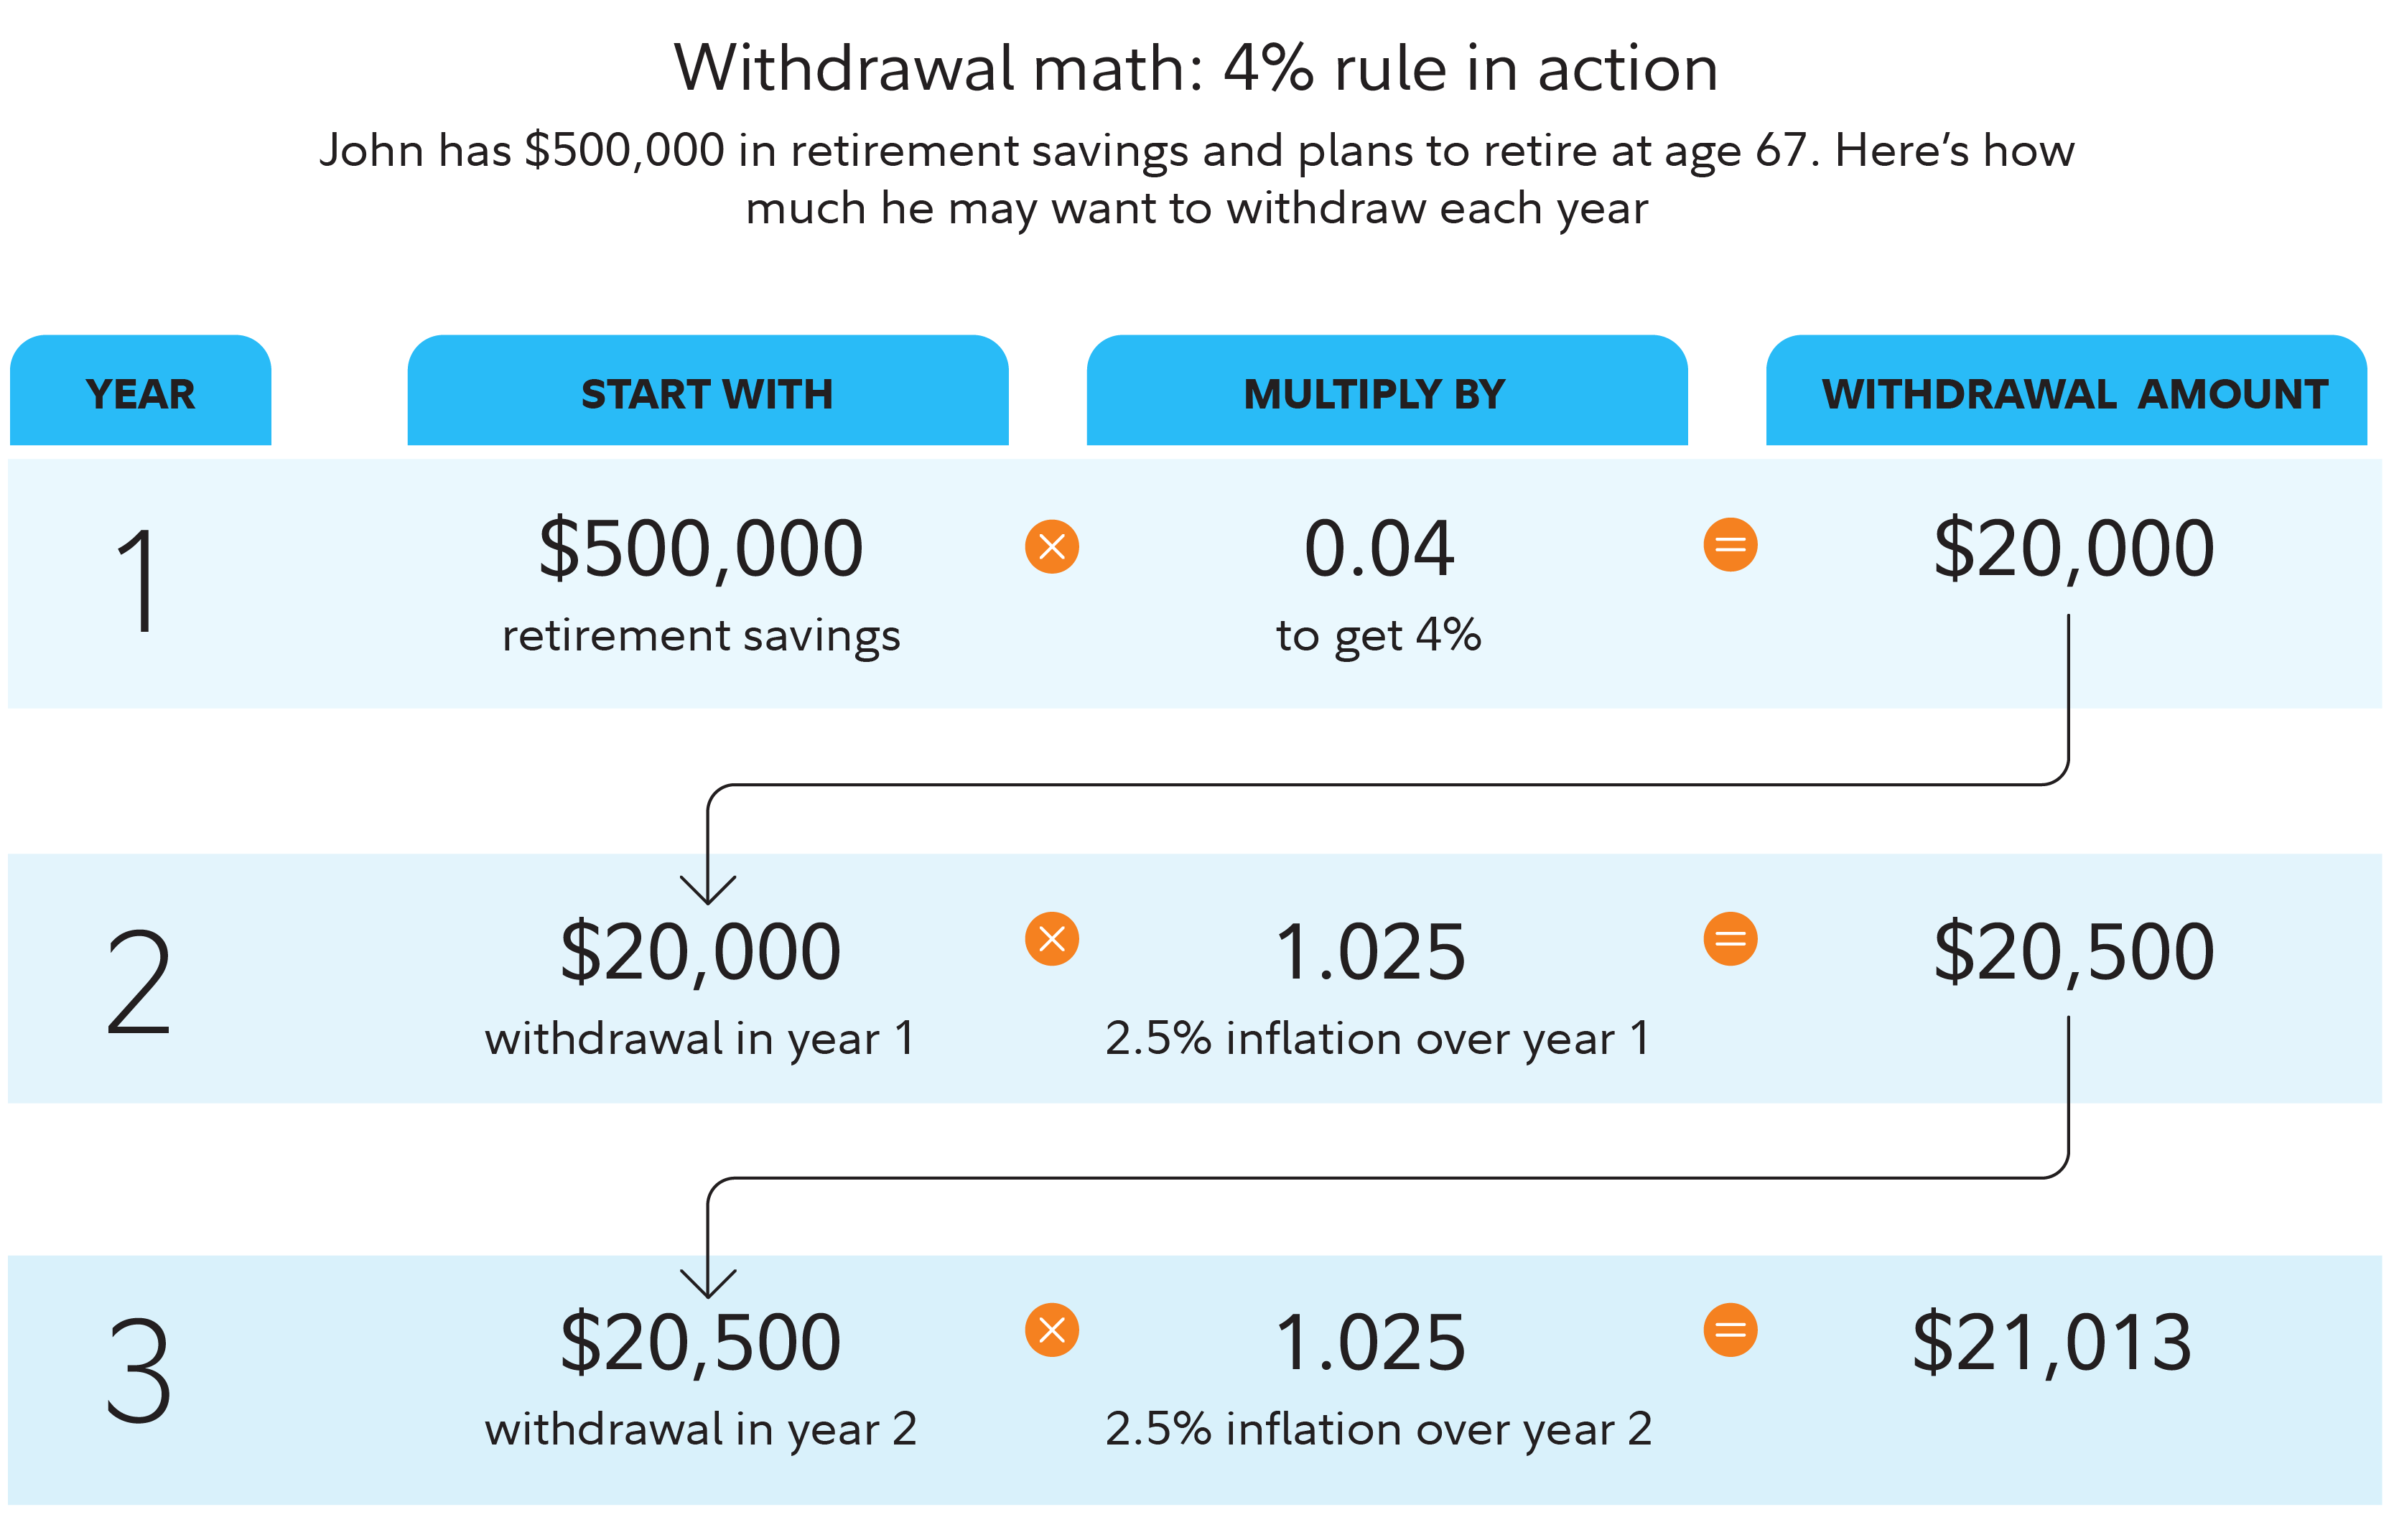
Let's look at a hypothetical example. John retires at age 67 with $500,000 in retirement accounts. He decides to withdraw 4%, or $20,000, each year for expenses. Since John plans on withdrawing an equivalent inflation-adjusted amount from savings throughout his retirement, this $20,000 serves as his baseline for the years ahead. Each year, he increases that amount by the rate of inflation—regardless of what happens to the market and the value of his investments.
A look back at history
Of course, your actual sustainable withdrawal rate will vary based on many things, including some you can't control (how long you live, inflation, and the long-term risk and return of the markets) and others over which you may have some control (your retirement age and the investments you choose).
History suggests that the prevailing market environment at the time of your retirement may be particularly important, as a weak market early in retirement can significantly diminish your nest egg, especially if you don't dial down your withdrawals with the declining markets. On the other hand, a strong stock market early in retirement can put the wind at your back—financially speaking—for decades.
Unfortunately, it’s impossible to know what the stock market will be like when you retire. That’s one reason Fidelity suggests using guaranteed income sources for essential expenses in retirement. That way your necessities are taken care of, no matter what the market does.
Consider the following chart, which illustrates a historical look at how much an investor could have withdrawn from savings without running out of money over a 28-year retirement, depending on the date of retirement. As you can see, actual sustainable withdrawal rates varied widely,2 from just under 10% if you retired in 1982, at the beginning of a roaring bull market, versus more than 4% if you retired in 1937, during the Great Depression.

This analysis is based on a 90% chance that the portfolio would not run out of money within a given retirement horizon. The 90% confidence level reflects the "strong plan" framework used in Fidelity's retirement planning tools.3
Of course, 4% to 5% is just a starting point. Our research and the interactive tool below show how things you can control—like your retirement age and investment mix—can play a role in figuring out the right number for you.
When determining how to make your retirement savings last, take your timeline into account
One of the biggest factors that affects how much you can withdraw is how many years of retirement you plan to fund from your retirement savings. Say you plan on a retirement of 30 years, you invest in a balanced portfolio, and want a high level of confidence that you won't run out of money. Our research shows that a 4.6% withdrawal rate would have been sustainable 90% of the time (see the following graph).4
But if you work longer—say you expect to retire at age 70—or if you have health issues that compromise your life expectancy, you may want to plan on a shorter retirement period—say, 25 years. The historical analysis shows that, over a 25-year retirement period, a 5.0% withdrawal rate has worked 90% of the time.
On the other hand, if you are retiring at age 60 or have a family history of longevity, you may want to plan for a 35-year retirement. In that case, 4.4% was the most you could withdraw for a plan that worked in 90% of the historical periods. These may sound like small differences, but they could equate to thousands of dollars in annual retirement income.
The good news is that even with the market's historical ups and downs, these withdrawal amounts worked most of the time—assuming that investors stuck to this balanced investment plan. (See footnote 5 for more details on how these results were calculated.) The takeaway from this analysis is that the longer your retirement lasts, the lower the sustainable withdrawal rate.

For people whose retirement planning includes a spouse or partner, it's important to consider not only the life expectancy of each person, but also the likelihood that one or the other will still be living (referred to as joint life expectancy).
To maximize your retirement savings, how you invest can be important
The mix of investments you choose is another key to how much you can withdraw without running out of money. Portfolios with more stocks have historically provided more growth over the long term—but have also experienced bigger price swings.
Another important factor in determining the right asset mix for you: the degree of confidence you need that your money will last your lifetime. As the chart below illustrates, in about half of the hypothetical scenarios we tested, a growth portfolio (70% stocks, 25% bonds, and 5% cash) would have allowed you to withdraw more than 7% each year over 25 years of retirement—over 25% more than a conservative portfolio (20% stocks, 50% bonds, and 30% cash) with a sustainable withdrawal rate of 5.4%.6
If you want a much higher degree of confidence, the analysis suggests that increasing equity exposure doesn’t raise the sustainable withdrawal rate, and in fact becomes counterproductive. At a 90% confidence level, the sustainable withdrawal rate for the conservative portfolio is 4.2%, versus 4.5% for the growth portfolio. For a 99% confidence, the analysis suggests you could withdraw 4.1% from the conservative portfolio, versus only 3% from the growth portfolio.6

If you feel you need high confidence that your savings will last throughout retirement—and in particular if you find volatility unnerving—history suggests that a high allocation to stocks may be less attractive to you.
Note: Diversification and asset allocation do not ensure a profit or guarantee against loss.
For people who do keep a relatively high level of stocks in their investment mix, it can make sense to adjust your withdrawals during times of market volatility. An unwavering 4%-5% withdrawal rate may not be suitable for every person in unpredictable social, economic, or market conditions. To help boost the odds that your money can last through retirement, it can make sense to reduce withdrawals during times of market stress if possible. The preceding analysis assumes you stay invested over the retirement horizon while withdrawals are taken.
And finally, the assumptions behind the sustainable withdrawal rate are based on an investor who stays invested during market volatility. The results may vary for investors who sell their portfolio and move to cash during short-term market drops.
Consider the role of guaranteed income1
Choosing the right withdrawal rate can improve your odds of success, but it won't guarantee that you won't run out of money. Some products, like annuities, do offer that guarantee.1 While investing always involves risk, some insurance products guarantee a stream of income payable for as long as you live, thus eliminating the risk of outliving that portion of your savings.
Income annuities offer one way to deal with the lifetime income challenge, particularly when it comes to essential expenses. And they do have benefits: Unlike investments, fixed income annuity payments are not dependent on the markets and they continue making regular and predictable payments in any market environment. Plus, annuities tend to be convenient since they don’t require any ongoing maintenance. For those who invested in an annuity earlier in life, this ease of maintenance could be especially comforting if they eventually have health problems or cognitive difficulties. Of course, there are trade-offs: Most income annuities restrict or even eliminate your access to your assets, and are subject to the claims-paying ability of their issuers.
Overall, we believe that annuities, together with other guaranteed income sources like Social Security and pensions, can be the best way to cover essential expenses, and sustainable withdrawals from savings are best used for expenses that can be more easily adjusted.
Bottom line
For many people, planning for withdrawals in retirement can be challenging. And no wonder, given the range of uncertainties, from how long you will live, to market performance, inflation, taxes, and more. Our guideline provides a starting point, but every individual needs to consider these uncertainties, and their personal situation, when evaluating how much they can sustainably spend in retirement.
Tips:
- Estimate how long you think you will live based on your health and family history. Since many people underestimate their lifespan, you may want to make your estimate a higher number of years.
- Evaluate how much investment risk you can live with.
- Choose an appropriate mix of investments.
- Make sure your money is likely to last, by choosing a withdrawal rate you believe has a good chance of success.
Use our calculator to estimate your monthly retirement income in dollars. But don't stop there. As you approach retirement, consider generating a more complete plan with the help of our planning tools,3 or working with a financial consultant.
You may find that a little planning can help to give you more confidence, so that even if you can't know the future, you will be more prepared for what comes your way.