When it comes to money matters, you could say people have 2 ways of thinking—the long view and the right now. Both can work in different situations. But when it comes to investing, particularly in falling markets, short-term thinking can be dangerous to your long-term financial health.
When you see the value of your investments drop, do you want to sell? It's a normal emotional reaction to loss. But selling at market lows means locking in losses and giving up growth potential if markets rebound. Sure, it would be great if we could easily time the ups and downs of the market, but history shows that’s just not possible. On the other hand, keeping your money in cash sacrifices any potential growth that investing might achieve.
So how do you manage your emotions during market downturns? One way is to work with an investment professional who can help you test-drive your investment plan by illustrating the potential trade-offs of different strategies under different market scenarios. Doing this before the market pulls back can keep you cool when it does.
What bailing out can cost
Consider Sally and Hector, ages 64 and 65, a hypothetical couple who plan to retire at ages 65 and 66, respectively. They have about $1 million, which is currently invested 35% in US stocks, 15% in international stocks, 40% in bonds, and 10% in cash, and their home has about $800,000 of equity. The currently spend all they make and do not put anything into savings.
A recent sharp stock market drop rattled the couple. Hector had trouble sleeping and was checking his portfolio daily. The couple seriously considers selling most of their stocks and putting that money in a money market fund to ease their stress and try to protect what they had saved.
When they meet with their Fidelity advisor, she helps them explore the potential impact of making a big change in their investment strategy. She uses planning software that runs hypothetical scenarios and illustrates the potential implications of the investment paths they are considering.
Scenario 1: Maintain their balanced portfolio
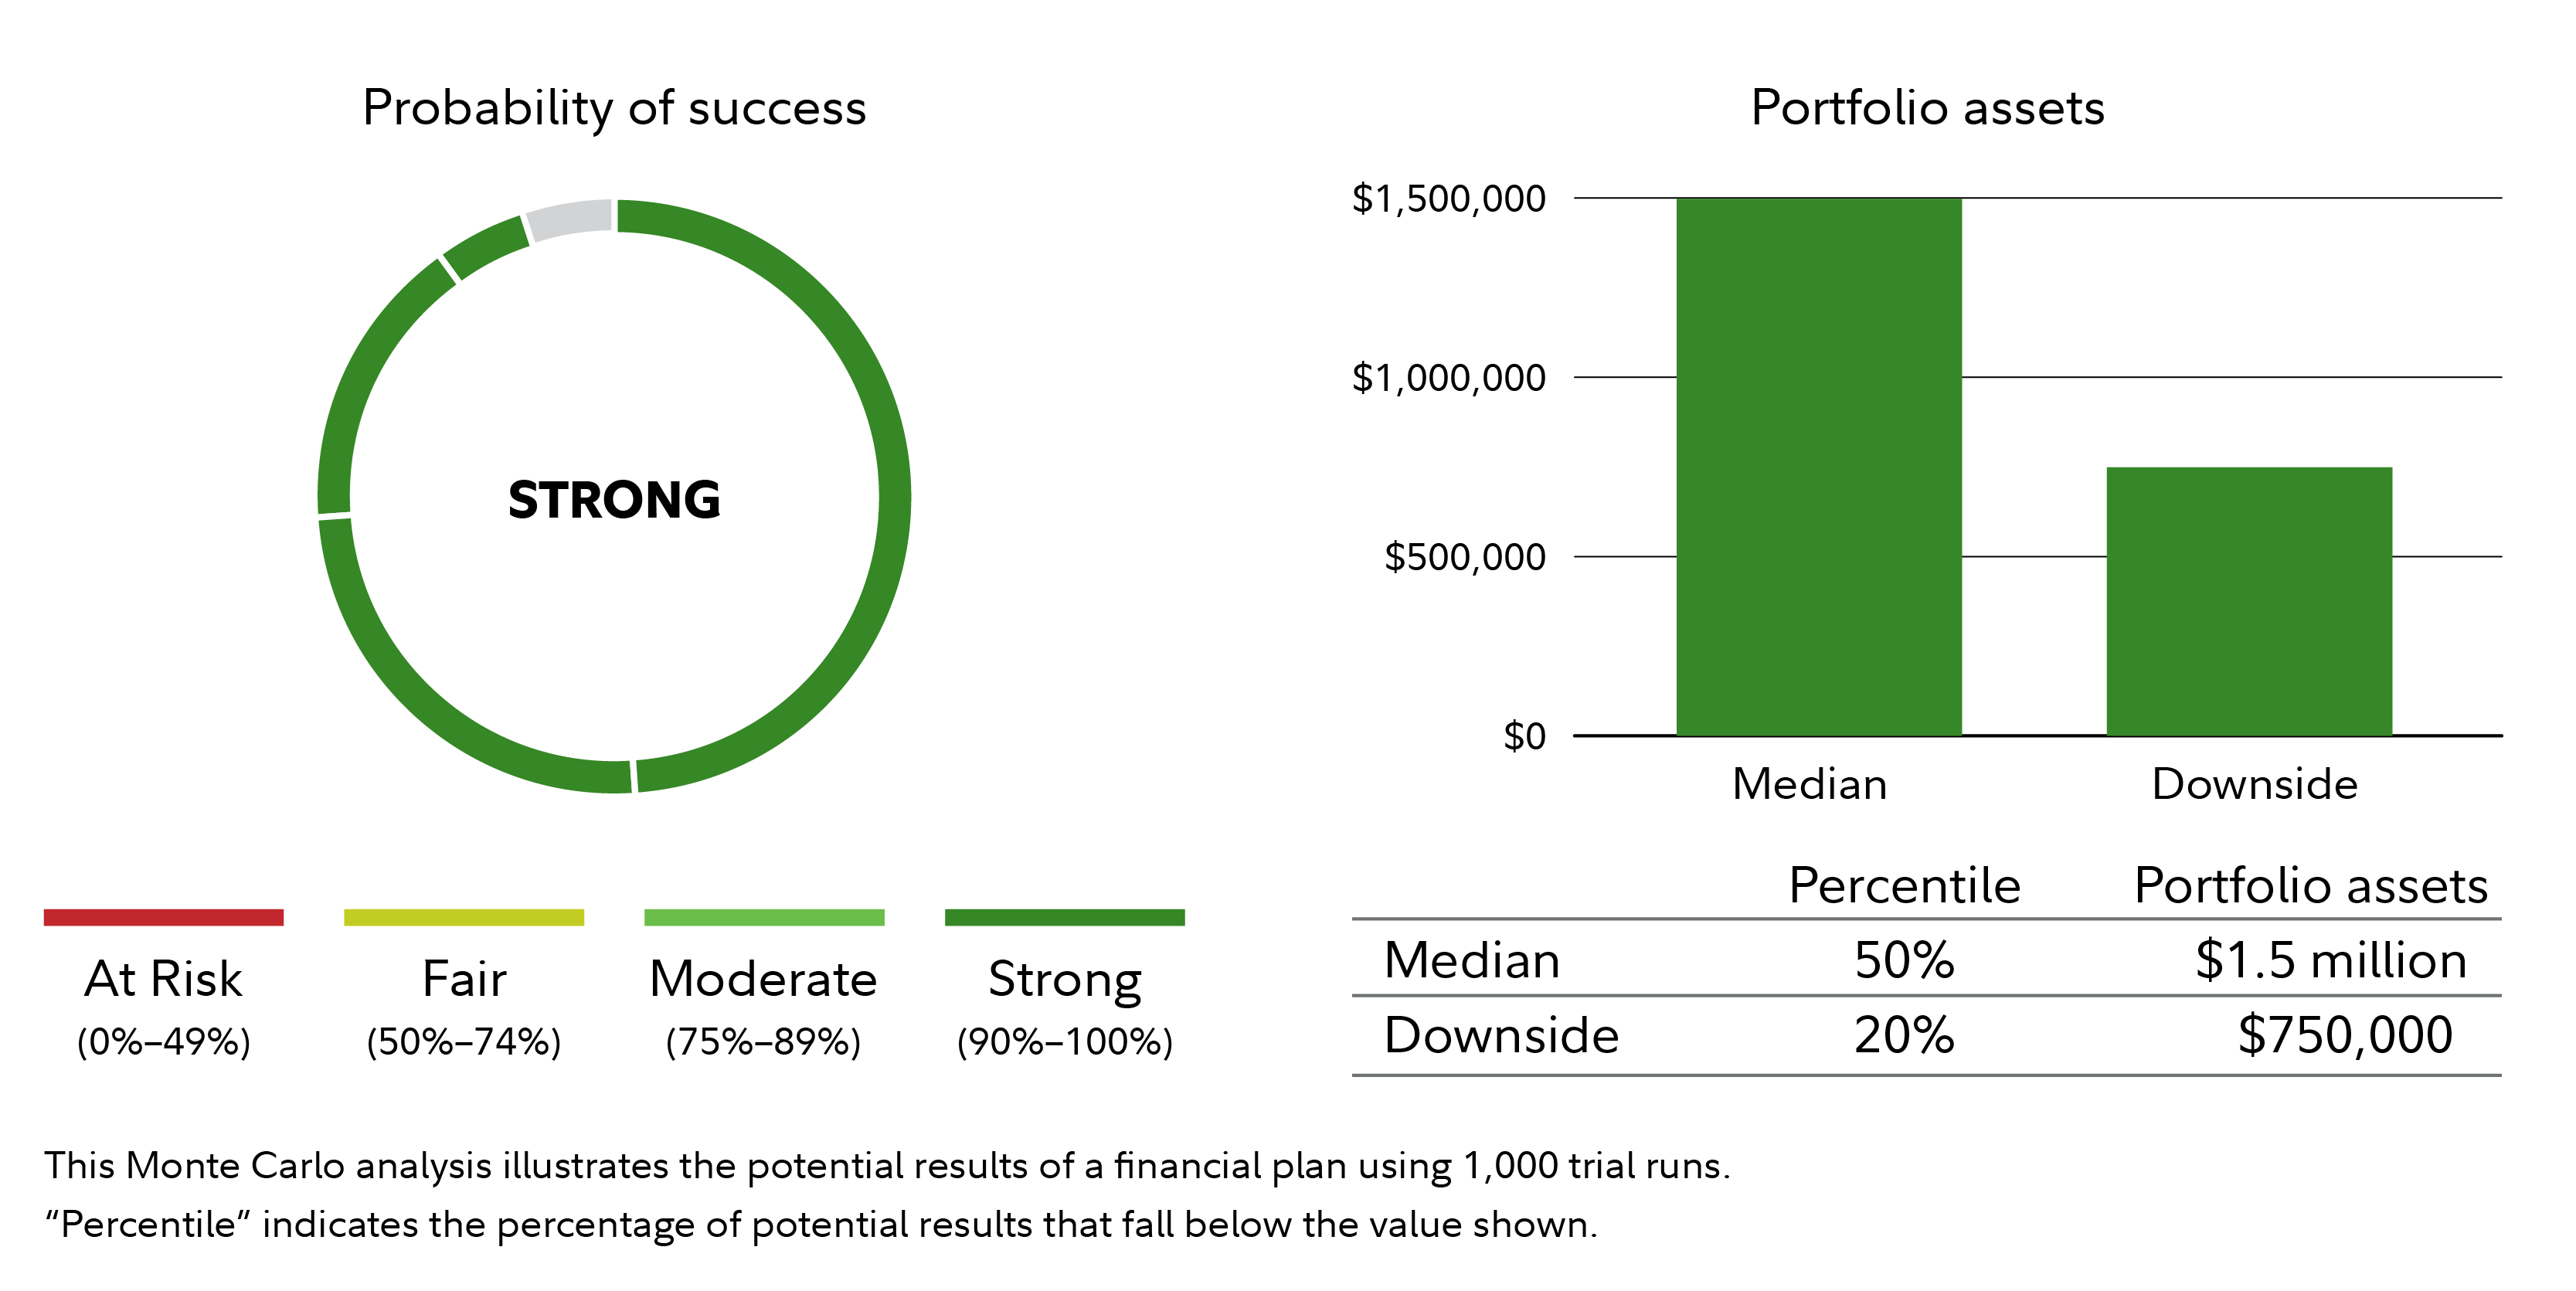
To help Sally and Hector consider their options, their Fidelity advisor runs a series of hypothetical scenarios using a financial planning tool. These market simulations are illustrations based on the historic performance of stocks, bonds, and other investments. They run 1,000 market simulations, and the projections show that if Sally and Hector stay invested in a balanced portfolio, their savings have a "strong" probability of lasting until the couple reaches age 96.1 In a typical "median" market, the couple could potentially leave nearly $1.5 million as a legacy for their family.

The projections and other information generated by eMoney Advisor regarding the likelihood of various investment outcomes are hypothetical in nature, do not reflect actual investment results, numbers are rounded up and are not guarantees of future results. Results may vary with each use and over time. The percentile indicates the rank of the scenarios among the 1,000 simulations. So, 50% of scenarios outperformed the median and 50% underperformed. The downside shows the scenario in the worst 20% of scenarios, 80% performed better. The probability of success is based on the percentage of market scenarios in which the plan funded the income needs to the planning age. These scenarios assume Hector claims $32,000 of Social Security annually, indexed for inflation, starting at age 66 and Sally claims $24,000 annually, indexed to inflation, starting at age 65, and that the couple will have $94,000 in annual expenses, adjusted for inflation, from when they start retirement through age 96. The starting balance is $1 million.
Scenario 2: Adopt a conservative investment strategy
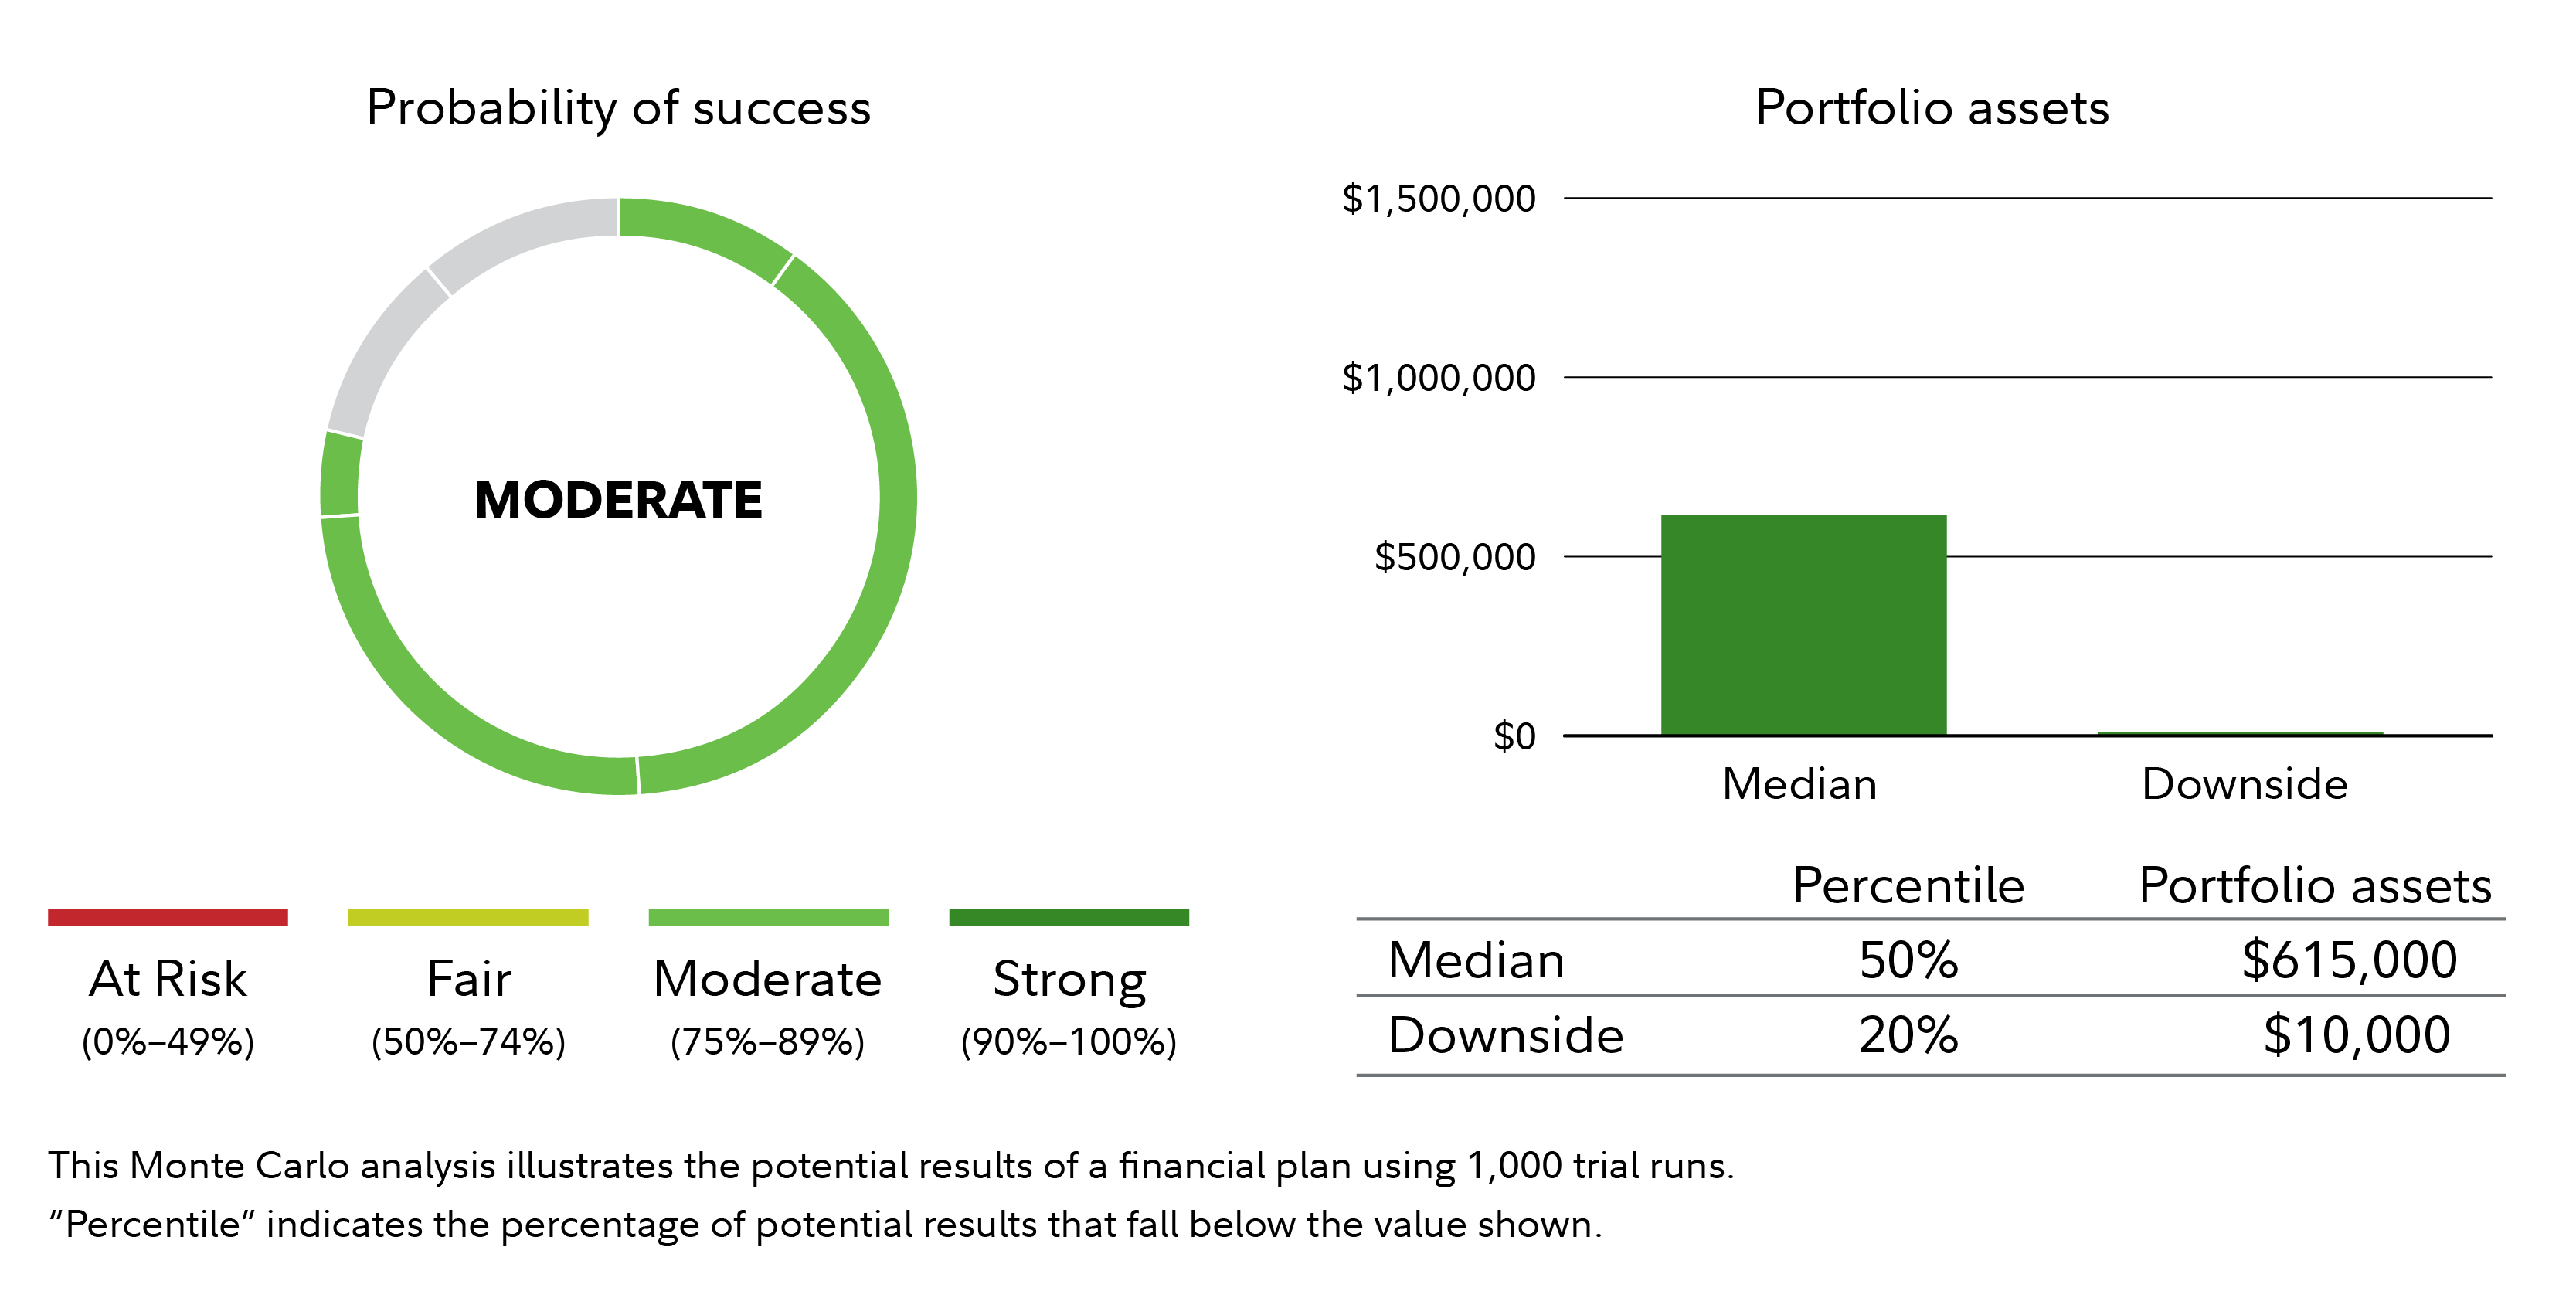
If the couple were to adjust their investment strategy in the hopes of minimizing losses, the picture changes. Using the same financial planning tool, the Fidelity advisor tested what it might mean if the couple were to adjust their investments from a balanced portfolio to a more conservative portfolio, with only 20% of their investments in stocks and 80% in bonds and short-term investments, like money market funds.2 After running 1,000 hypothetical market scenarios, the illustration suggests that the couple’s retirement would have a moderate probability of success at leaving a legacy.
In a very difficult market, defined in this case as the worst 20% of hypothetical market scenarios, the illustration suggests the couple might only have a savings of $10,000, which might mean some difficult lifestyle choices.

The projections and other information generated by eMoney Advisor regarding the likelihood of various investment outcomes are hypothetical in nature, do not reflect actual investment results, numbers are rounded up and are not guarantees of future results. Results may vary with each use and over time. The percentile indicates the rank of the scenarios among the 1,000 simulations. So, 50% of scenarios outperformed the median and 50% underperformed. The downside shows the scenario in the worst 20% of scenarios, 80% performed better. The probability of success is based on the percentage of market scenarios in which the plan funded the income needs to the planning age. These scenarios assume Hector claims $32,000 of Social Security annually, indexed for inflation, starting at age 66 and Sally claims $24,000 annually, indexed to inflation, starting at age 65, and that the couple will have $94,000 in annual expenses, adjusted for inflation, from when they start retirement through age 96. The starting balance is $1 million.
Scenario 3: Adopt a moderately more conservative investment strategy
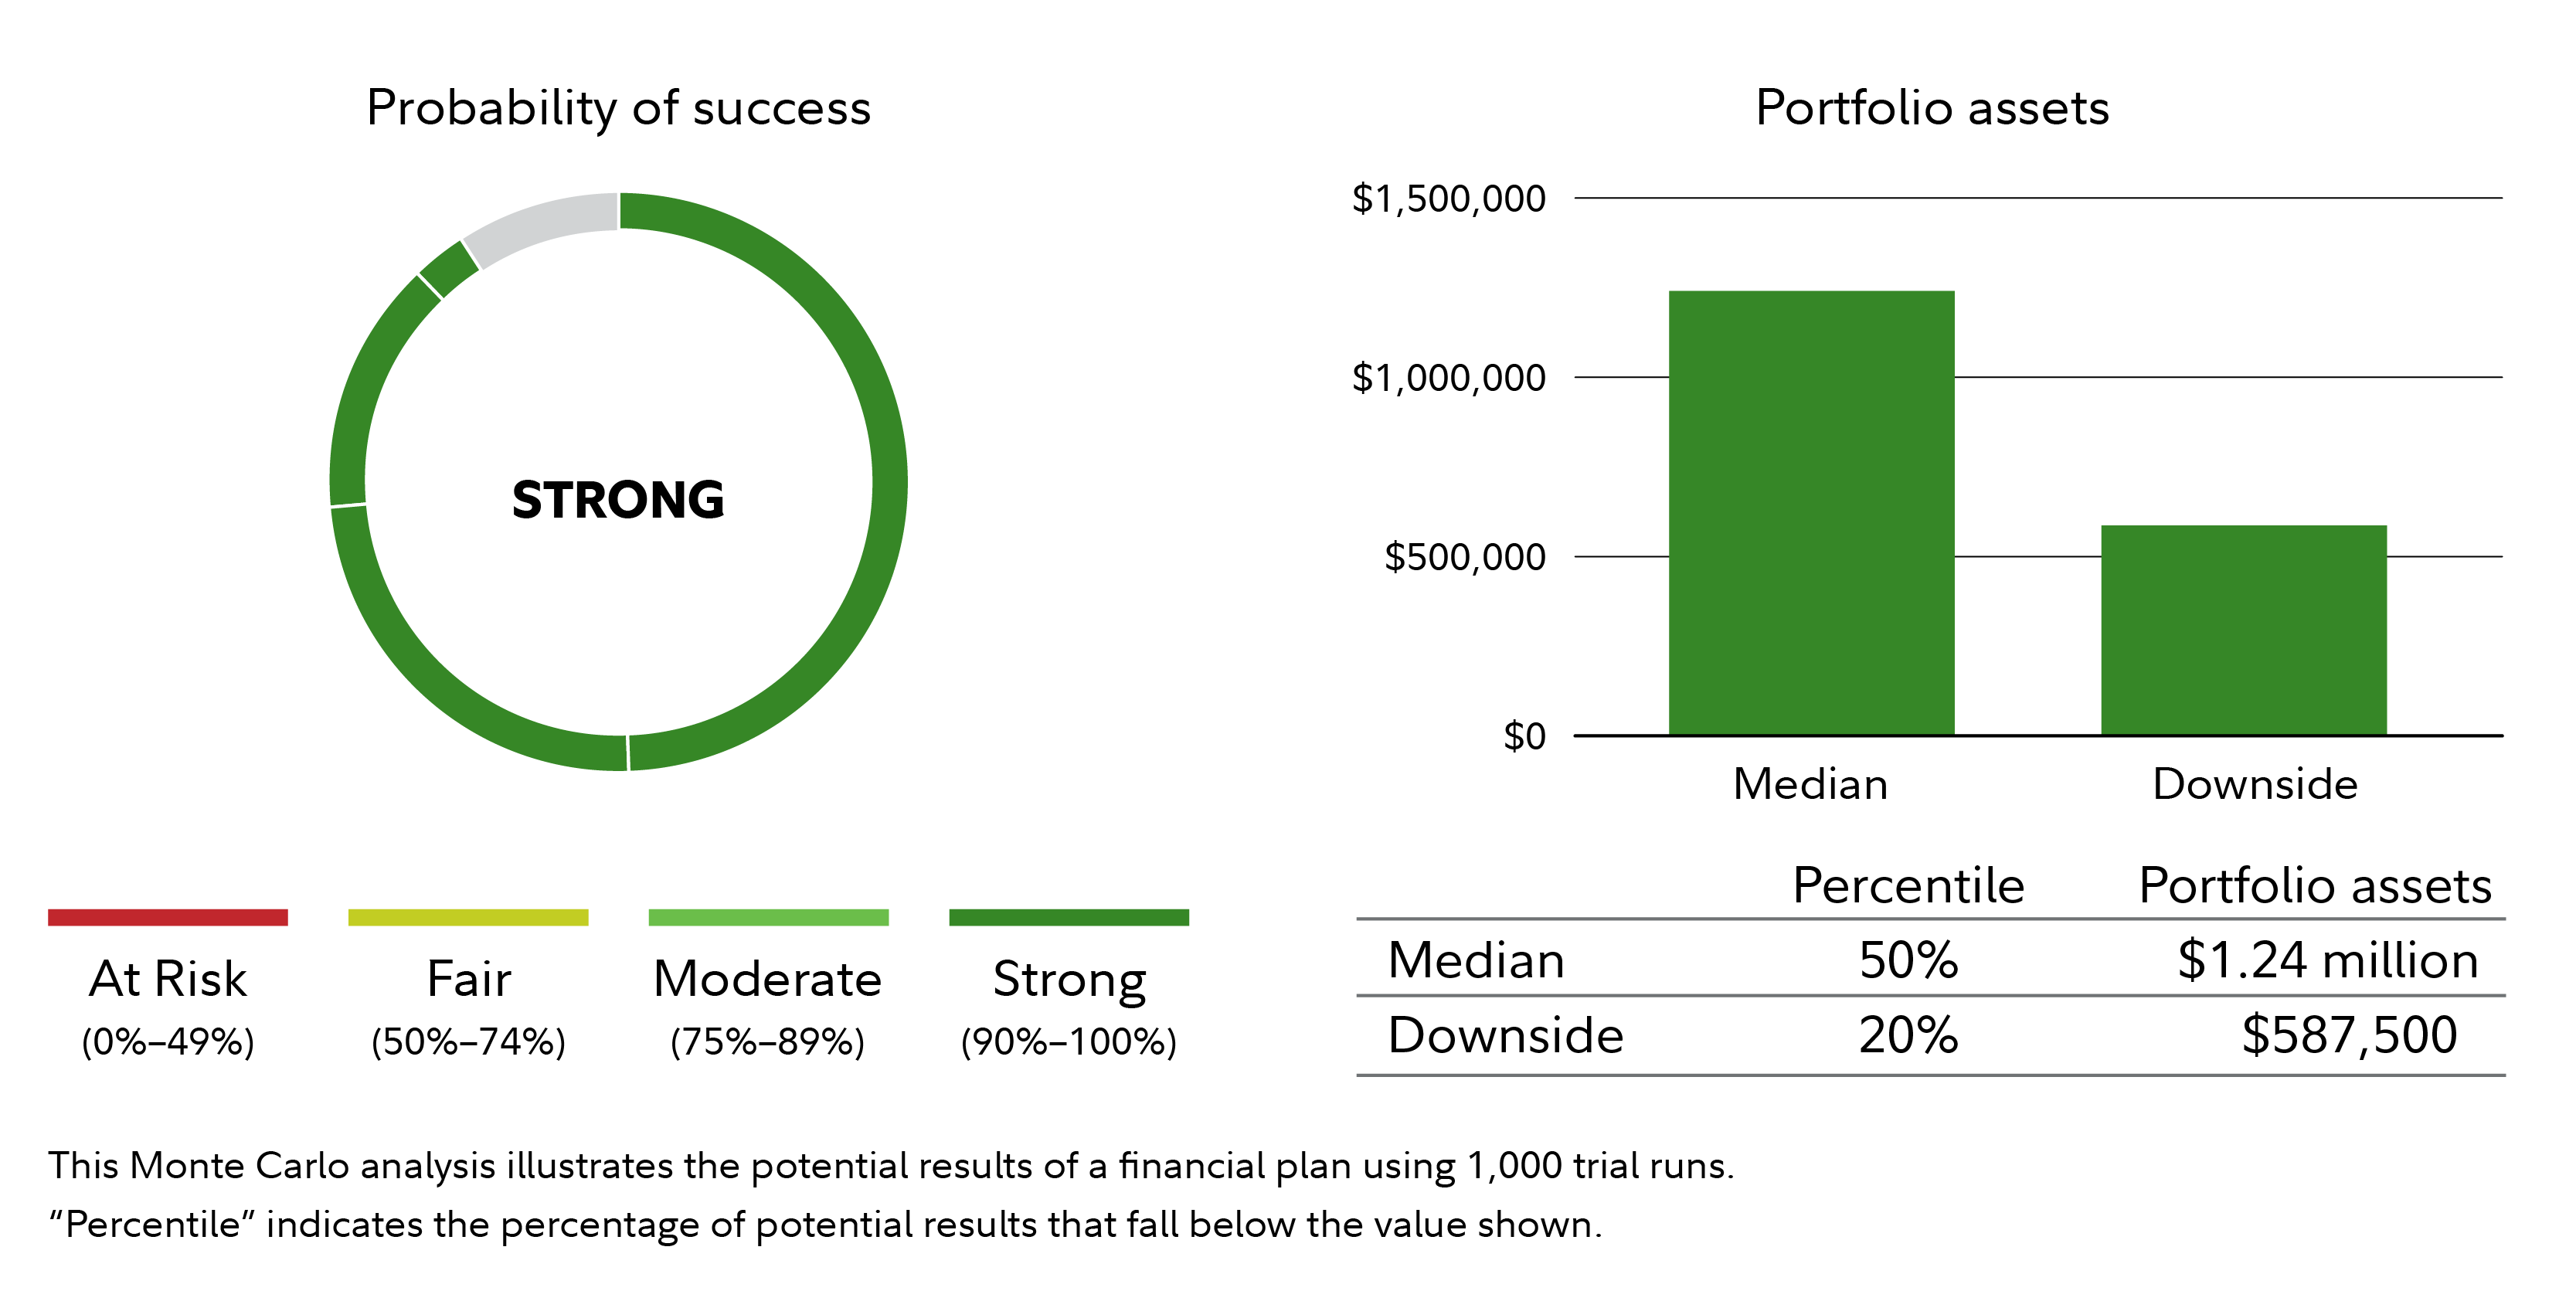
Instead of reacting emotionally, Sally and Hector revisit their long-term goals and their financial situation. They certainly don’t want to run out of money in retirement, but they are still uneasy about the markets. They want to consider a more conservative investment option. So their advisor shows them the range of potential outcomes with a slightly more conservative portfolio of 40% stocks and 60% bonds.3
With this approach, the illustration indicates their plan is still strong. In the worst 20% of 1,000 market simulations, the more conservative investment portfolio might reduce their savings significantly, compared to a balanced portfolio of 50% stocks and 50% bonds and short-term debt. But in the median market scenario, the moderately more conservative option might still significantly reduce their wealth and legacy versus the balanced investment strategy.

The projections and other information generated by eMoney Advisor regarding the likelihood of various investment outcomes are hypothetical in nature, do not reflect actual investment results, numbers are rounded up and are not guarantees of future results. Results may vary with each use and over time. The percentile indicates the rank of the scenarios among the 1,000 simulations. So, 50% of scenarios outperformed the median and 50% underperformed. The downside shows the scenario in the worst 20% of scenarios, 80% performed better. The probability of success is based on the percentage of market scenarios in which the plan funded the income needs to the planning age. These scenarios assume Hector claims $32,000 of Social Security annually, indexed for inflation, starting at age 66 and Sally claims $24,000 annually, indexed to inflation, starting at age 65, and that the couple will have $94,000 in annual expenses, adjusted for inflation, from when they start retirement through age 96. The starting balance is $1 million.
Hector and Sally talked with their advisor. They had begun the planning process concerned about the short-term loss in the value of their portfolio. But taking a look at the long-term implications of making changes, and running 1,000 hypothetical market scenarios helped them focus on their long-term strategy. They decided to maintain a balanced portfolio, more comfortable now that they understood the balance between market risk and potential long-term growth.
Think long term
One of the challenges in investing is that downturns happen fairly regularly. When they do, it's natural to feel anxiety or even remorse about the losses. That's particularly true if you are living on your savings, or about to enter retirement. An investment plan can be designed for all kinds of markets, good and bad. But you need to be willing and able to stick with it over the long term. That’s where the coaching and scenario planning provided by an investment professional can help.
Fidelity has lots of options to assist, from digital tools you can use on your own, like the Planning & Guidance Center, to educational content, to a Fidelity advisor who can meet with you and review your plan.
The next time you feel worried, it may make sense to take the time to evaluate your choices. Try to get out of the moment by thinking about your goals and your long-term plan. If you need to talk to a professional, we can help.


