


While stocks are near all-time highs—the Dow blew past 50,000 earlier this summer and the S&P 500 has 8,000 in its sights thanks to strong earnings growth—the bond market has sent some troubling signals. Rates have continued to tick higher despite some extraordinary measures by the US Treasury to curb their rise, setting the stage for counterbalancing forces on the stock market.
What do the charts say? Investors that use indicators to help figure out which direction stocks may go over the short term can find that MACD may be giving a sell signal.
What MACD says now
The Moving Average Convergence-Divergence indicator, commonly known as MACD, is a technical indicator consisting of 2 lines—the MACD line and the signal line—as well as a bar chart.1 It is used to generate buy-and-sell signals based on readings of overbought (i.e., potentially expensive) or oversold (i.e., potentially cheap).
The chart below, which illustrates what MACD looks like under the price chart on top, shows how stocks have been trending higher since April and are now near all-time highs.
MACD applied to the S&P 500
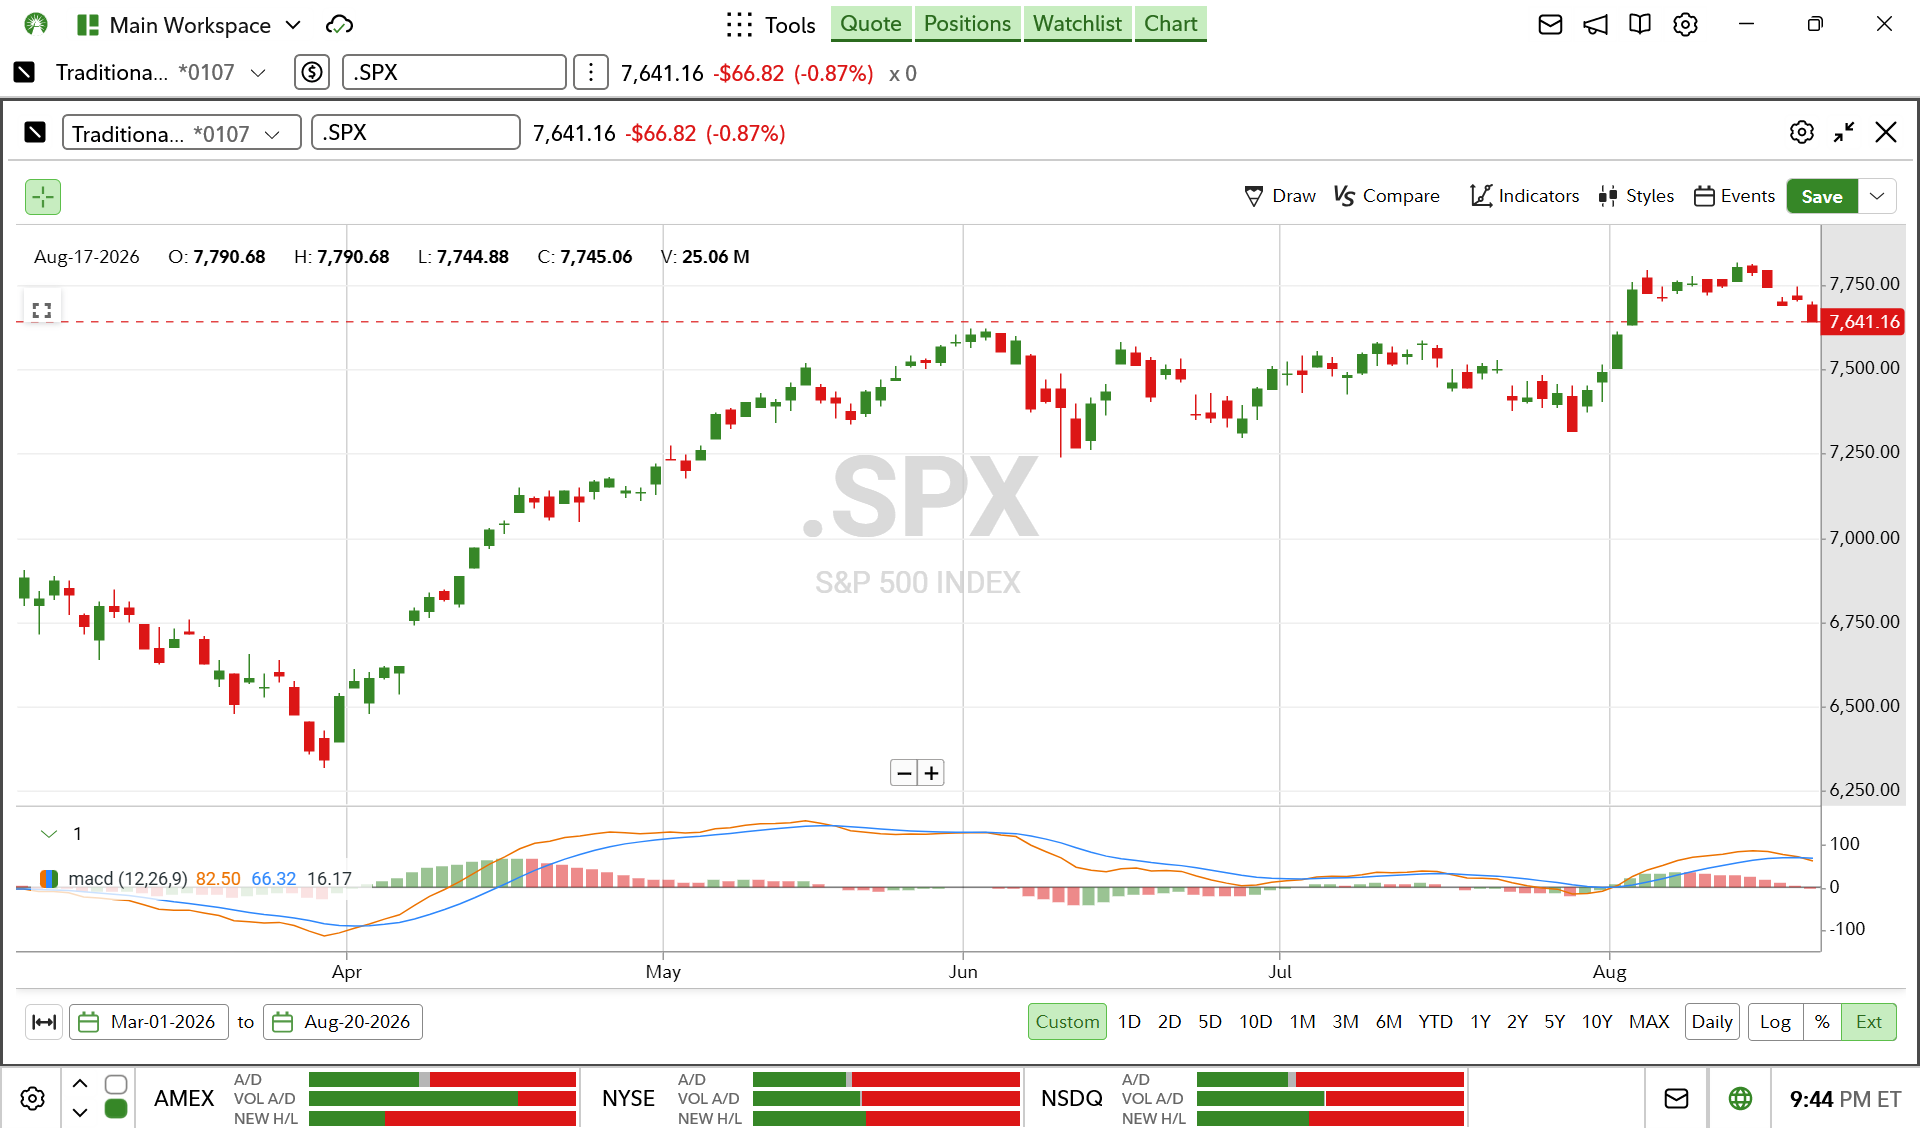
Short-term buy-and-sell signals are generated by the MACD line (the red line in the MACD section) and the signal line (the blue line in the MACD section). If the MACD line crosses above the signal line, this may be interpreted as a buy signal. Alternatively, if the MACD line crosses below the signal line, this may be interpreted as a sell signal. Stocks jumped higher after the MACD line crossed above the signal line back in early August. Recently, the MACD line crossed below the signal line—which was a sell signal.
These 2 lines fluctuate around the zero line. A sell signal is given when the signal line or the MACD line crosses below the zero line, and a buy signal is given when either cross above the zero line. The swift rally for the S&P 500 in early August corresponded to the MACD line crossing above the zero line (in addition to the signal line). The zero line is also significant because it can act as support and resistance.
MACD is a momentum oscillator that is generally best employed in trending markets—where prices are trending in a particular direction. And some chart users think oscillators like MACD are most valuable when they reach their boundary's extreme levels (i.e., the MACD and signal lines are relatively far away from the zero line). The signals using this interpretation would be as follows: When the MACD line is well below the zero line in extremely negative territory, it can suggest an investment may be oversold (i.e., a buy signal). Alternatively, when MACD is well above the zero line in extremely positive territory, it can suggest an investment may be overbought (i.e., a sell signal). Currently, neither line is near what might generally be considered an extreme level. It's worth noting that MACD can theoretically rise or fall indefinitely.
The difference line, represented in the MACD section by the red and green bars, is typically presented as a bar chart around the zero line. This bar chart represents the difference between the MACD line and the signal line. It helps depict when a crossover may take place. Recall that a crossover generates buy-and-sell signals. A narrowing of the difference line (i.e., when the bars decrease) illustrates the potential for a crossover.
Confirming the trend
One technique that chart users may use to confirm the direction of the trend is to determine whether the MACD indicator is making higher highs or lower lows in conjunction with the price. Some traders that utilize this strategy wait for a "trigger," or some sort of confirmation of the divergence. While the S&P 500 has been making higher highs, MACD has not. This may suggest that there is some divergence between the bullish price action for stocks and where investors think the next move may occur.
In sum, MACD is suggesting stocks may face some headwinds over the near term. Of course, fundamental factors could quickly change this outlook. Keep an eye on the latest market developments, both in the charts and in other data, to stay ahead of the trend.