Commitment to execution quality
We work hard to get you a better price for your equity, ETF, and options orders—every time you buy or sell. It's called price improvement, and we saved our investors over $3.2 billion on trades in 2025.3 Along with transparent pricing, it's part of the industry-leading value you can expect from Fidelity.
Unmatched value with Fidelity's price improvement
![]()
Saves you money
Our price improvement1 can save investors $26.69 on average for a 1,000-share equity order.
![]()
Shows your savings
Easily see your savings for an individual order, as well as over multiple time periods, on our pricing summary.
![]()
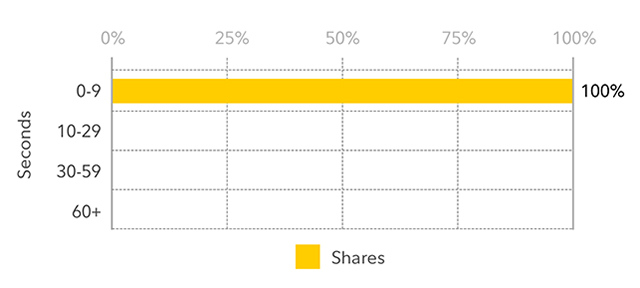
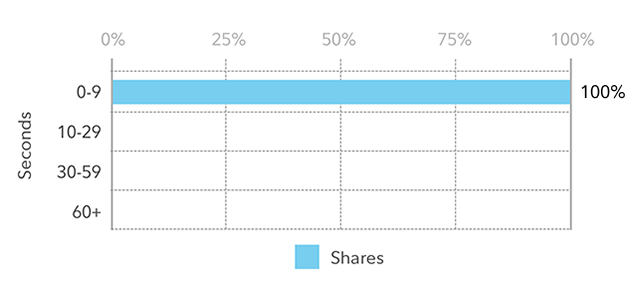
Shares for industry comparison
How it works
Price improvement occurs when a trade is executed at a better price than the best quote market price or National Best Bid and Offer (NBBO).
Get the full white paper
The benefits of enhanced execution quality for investors
Rated #1 for Order Execution by StockBrokers.com in 2023.
See how the savings can add up
Average price improvement1
For a 1,000-share equity order

Whether you trade a lot or a little, Fidelity's price improvement can help you save.
The proof is in the numbers
| Price improvement
Percentage of shares that are price-improved: |
|
| 95.37%
How it's measured |
| Execution price
Percentage of shares that fall within the NBBO: |
|
| 98.88%
How it's measured |
| Execution speed
Average execution speed: |
|
| 0.03 seconds
How it's measured |
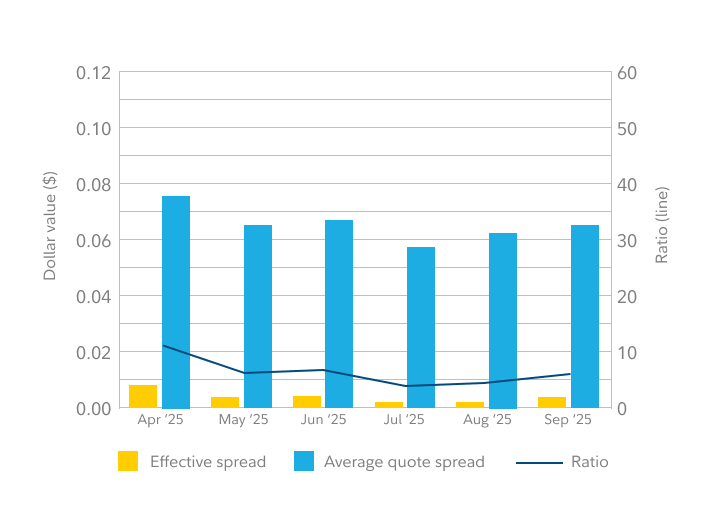
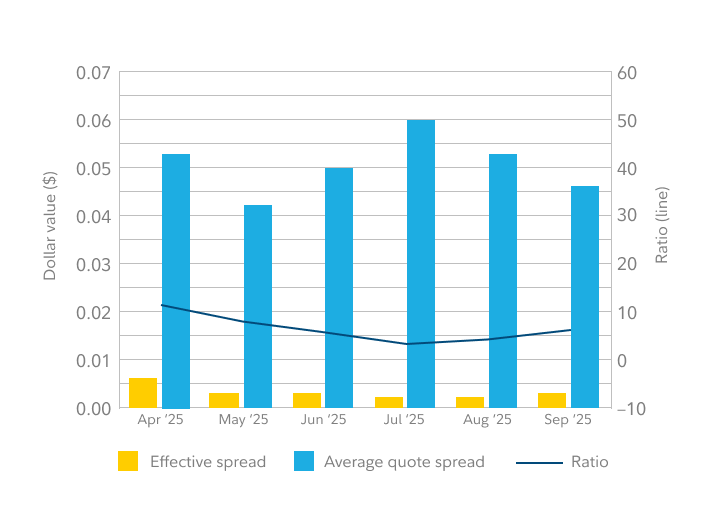
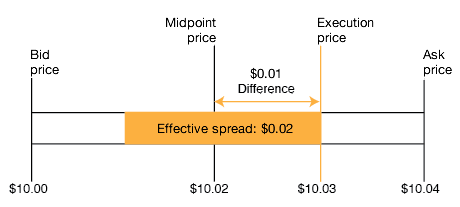
| Effective spread
Average effective spread: |
|
| $0.0056
How it's measured |
Source: Fidelity Q1 2026 statistics.
Applying high standards on every trade
Our Order Flow Management Team ensures that your order goes to the top-performing market centers, seeking the best execution price.