
Description
The Volume Oscillator (VO) works on the technical premise that it is not the actual level of volume, but the change in volume relative to the recent past that has more technical significance. The Volume Oscillator displays the difference between two moving averages of a security's volume expressed as a percentage.
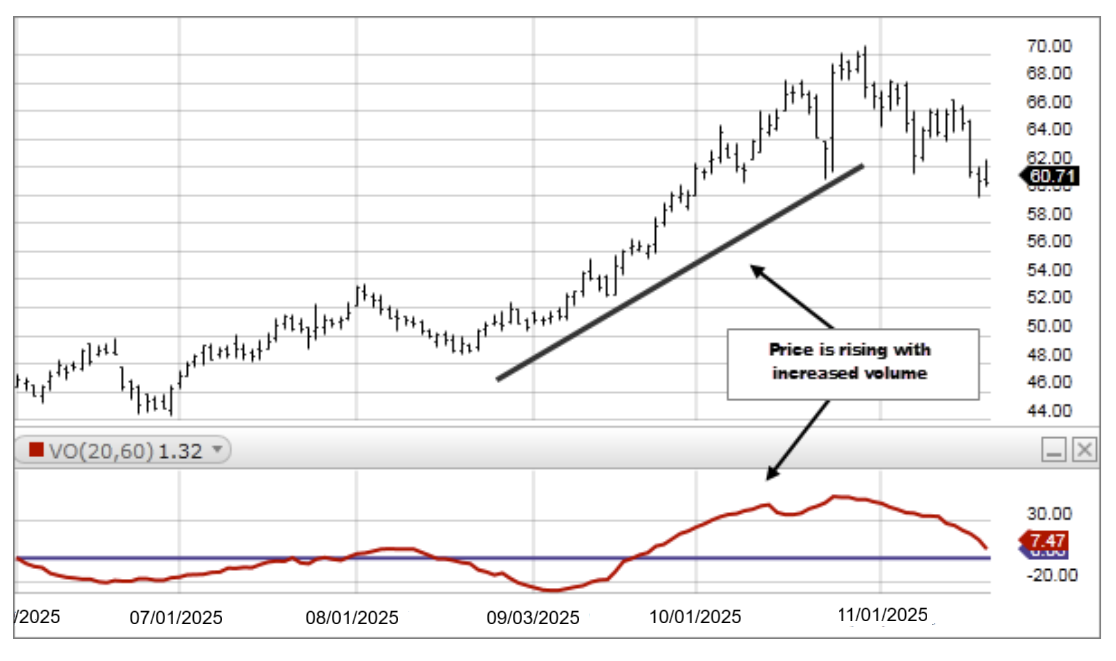
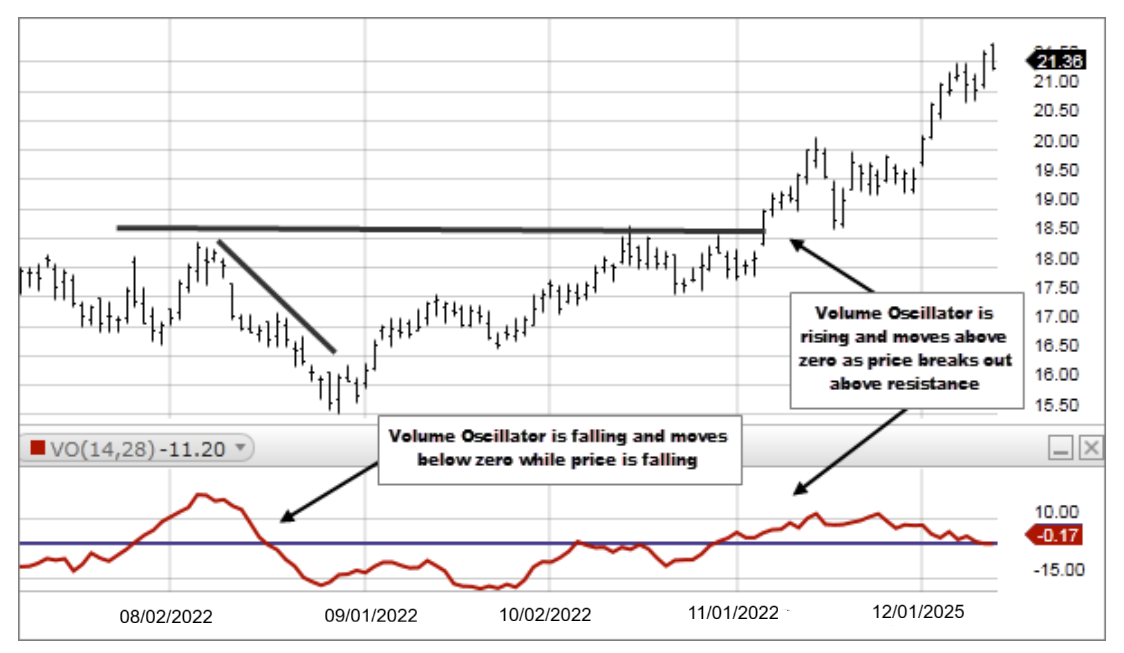
You can use the difference between two moving averages of volume to determine if the overall volume trend is increasing or decreasing. When the Volume Oscillator rises above zero, it signifies that the shorter-term volume moving average has risen above the longer- term volume moving average, and thus, that the short-term volume trend is higher (i.e., more volume) than the longer- term volume trend.
The Volume Oscillator can be used to confirm a support or resistance break. A support break on increasing volume indicates a stronger move than a support break on low volume. Similarly, a resistance break on expanding volume shows more buying intensity.
Volume Oscillator = [(Shorter Period SMA of Volume – Longer Period SMA of Volume) / Longer Period SMA of Volume ] * 100