Typical Price

Description

The Typical Price indicates an average of each day’s price.

Chart: Typical Price

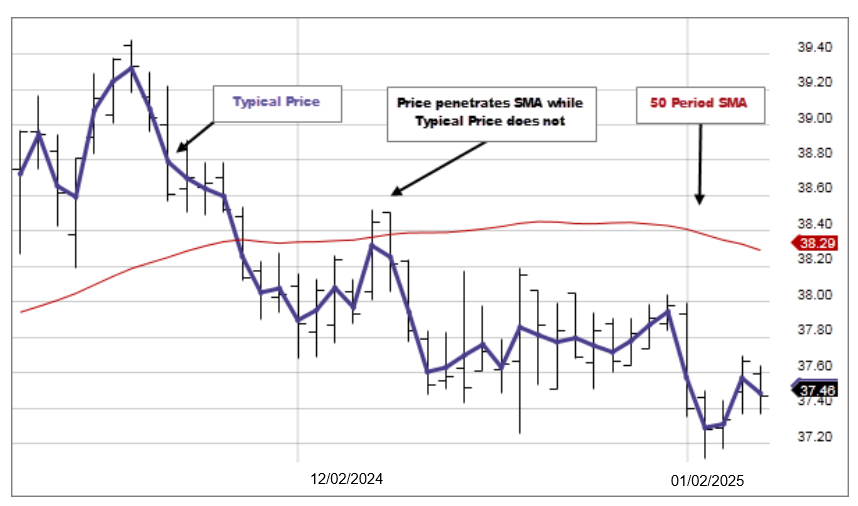
The Typical Price indicator provides a simple, single-line plot of the day’s average price. Some investors use the Typical Price rather than the closing price when creating moving-average penetration systems.

The Typical Price is a building block of the Money Flow Index.

Typical Price is calculated by adding the high, low, and closing prices together, and then dividing by three. The result is the average, or typical price.

Calculation: Typical Price

OR

Typical Price = ( High + Low + Close ) / 3

Technical analysis focuses on market action — specifically, volume and price. Technical analysis is only one approach to analyzing stocks. When considering which stocks to buy or sell, you should use the approach that you're most comfortable with. As with all your investments, you must make your own determination as to whether an investment in any particular security or securities is right for you based on your investment objectives, risk tolerance, and financial situation. Past performance is no guarantee of future results.

695495.2.0