
Description
The Stochastic RSI indicator, developed by Tushard Chande and Stanley Kroll, is an oscillator that uses RSI values, instead of price values, as inputs in the Stochastic formula. The indicator measures where the RSI’s current value is relative to its high/low range for the specified period.
Like RSI, StochRSI cycles between overbought levels above 80 and oversold levels below 20. The StochRSI reaches these levels much more frequently than RSI, resulting in an oscillator that offers more trading opportunities. StochRSI moves within the range of 0 to 100. Unlike RSI, StochRSI frequently reaches the extreme 0 and 100 levels.
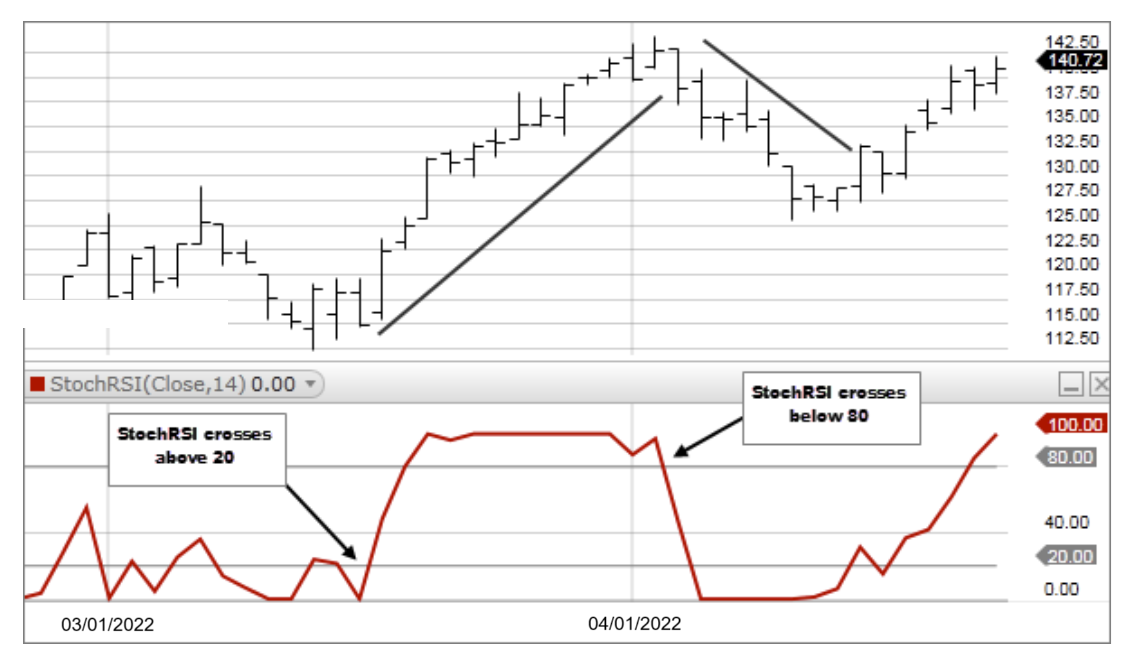
- Overbought and Oversold signals: A buy signal would be generated when StochRSI advances from oversold (below 20) to above 20. Conversely, a sell signal would be generated when StochRSI declines from overbought (above 80) to below 80. Note: As with many oscillators, StochRSI can become overbought (or oversold) and remain overbought (or oversold) for an extended period.
- Crosses of the 50 level can be used as a buying or selling signal. When StochRSI crosses above 50 then buy, when StochRSI crosses below 50 then sell.
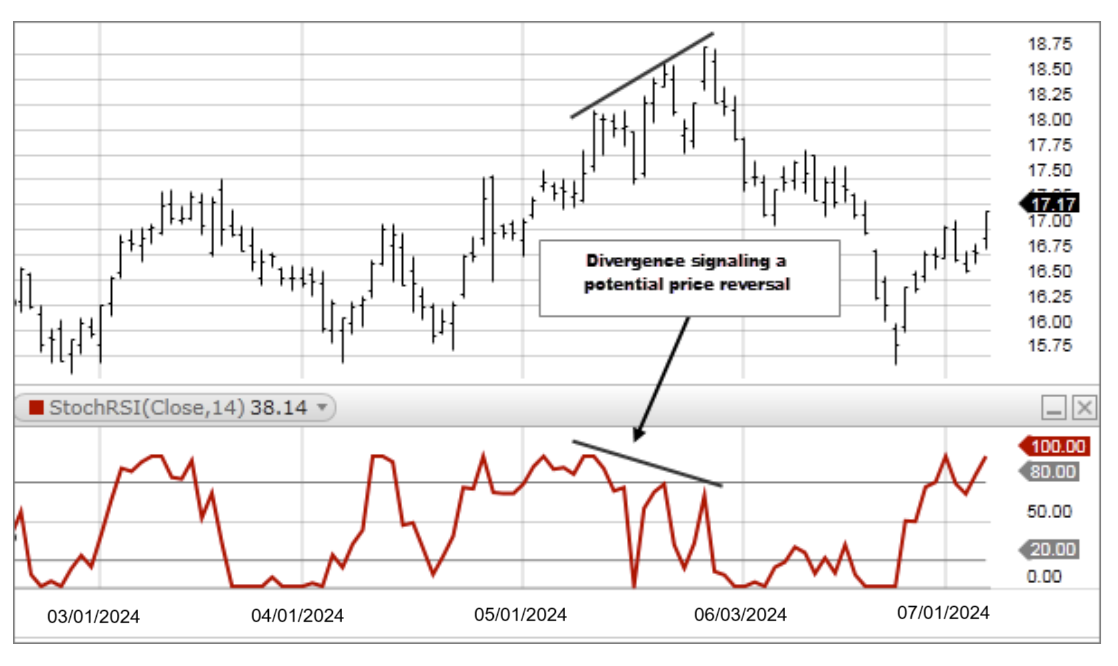
- If underlying prices make a new high or low that isn't confirmed by the StochRSI, this divergence can signal a price reversal.
StochRSI = [(Current RSI – Lowest Low RSI Value in n periods) / (Highest High RSI Value in n periods – Lowest Low RSI Value in n periods)] x 100