
Description
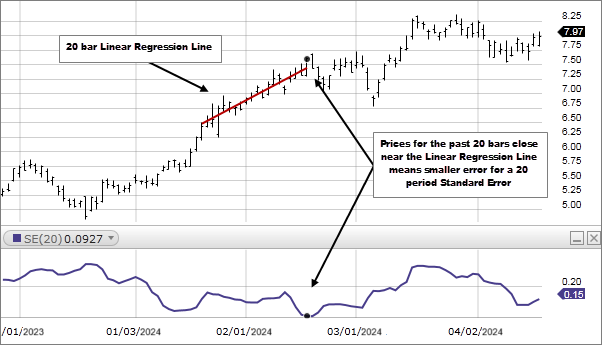
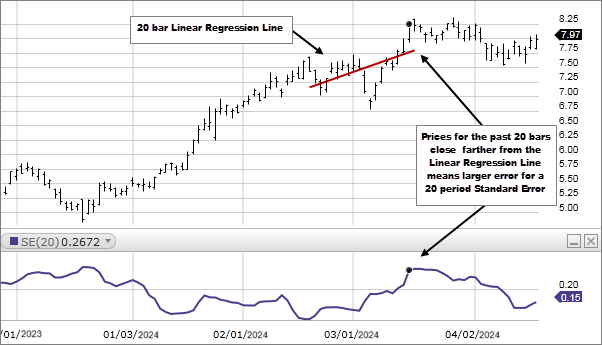
Standard Error, for a specified period, measures how far prices have deviated from a Linear Regression Line for the same period. The higher the Standard Error the farther prices have deviated from a Linear Regression Line for the same period. The lower the Standard Error, the closer the prices are to the Linear Regression Line. If all the closing prices equaled the corresponding values of the Linear Regression Line, Standard Error would be zero.
How this indicator works
- The larger the error, the less reliable the trend, as prices are dispersed away from the Linear Regression Line.
- The smaller the error, the more reliable the trend, as prices are congregating around the Linear Regression line.
Calculation
Standard Error is a fairly complex statistical calculation. It uses the least square fit method to fit a trend line to the data by minimizing the distance between the price and the Linear Regression trend line. This is used to find an estimate of the next period's price. The Standard Error indicator returns the statistical difference between the estimate and the actual price.
")