
Description
The Rate-of-Change (ROC) indicator, which is also referred to as simply Momentum, is a pure momentum oscillator. The ROC calculation compares the current price with the price "n" periods ago. The plot forms an oscillator that fluctuates above and below the zero line as the Rate-of-Change moves from positive to negative. Like other momentum indicators, ROC has overbought and oversold zones that may be adjusted according to market conditions. Remember, a security can become oversold/overbought and remain oversold/overbought for an extended period.
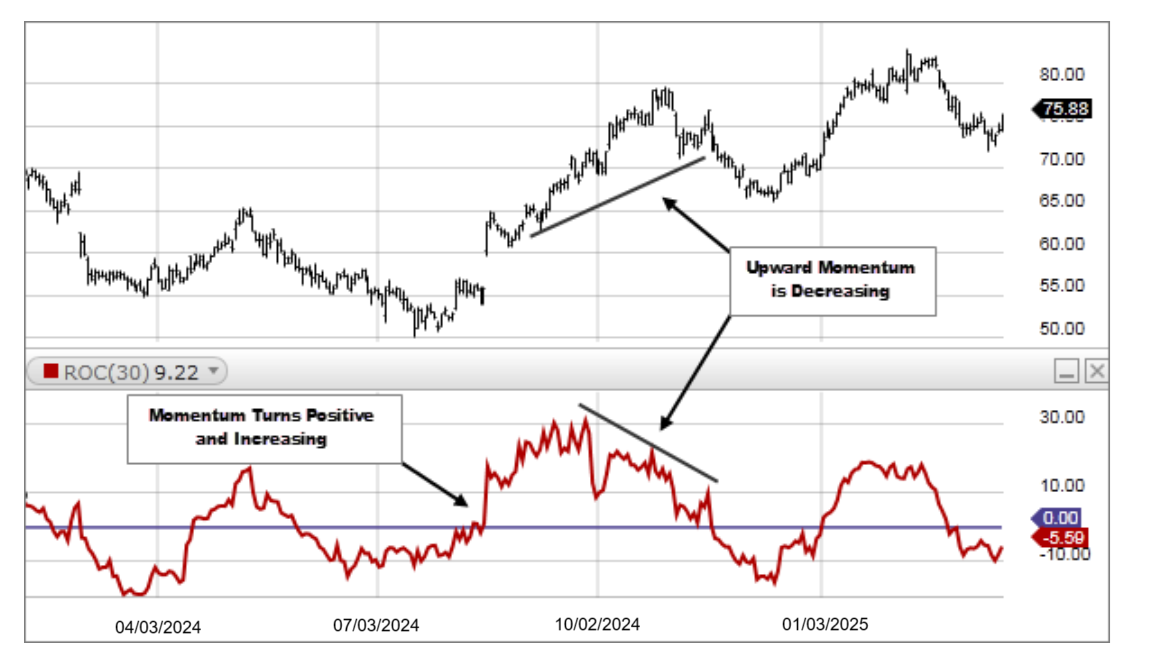
- An upward surge in the Rate-of-Change reflects a sharp price advance. A downward plunge indicates a steep price decline.
- In general, prices are rising as long as the Rate-of-Change remains positive. Conversely, prices are falling when the Rate-of-Change is negative.
- ROC expands into positive territory as an advance accelerates. ROC moves deeper into negative territory as a decline accelerates.
ROC is the percentage change between the current price with respect to an earlier closing price n periods ago.
ROC = [(Today’s Closing Price – Closing Price n periods ago) / Closing Price n periods ago] x 100