
Description
The Relative Vigor Index (RVI) is an oscillator based on the concept that prices tend to close higher than they open in up trends and close lower than they open in down trends. Basically, it is an oscillator that is in phase with the cycle of the underlying’s price.
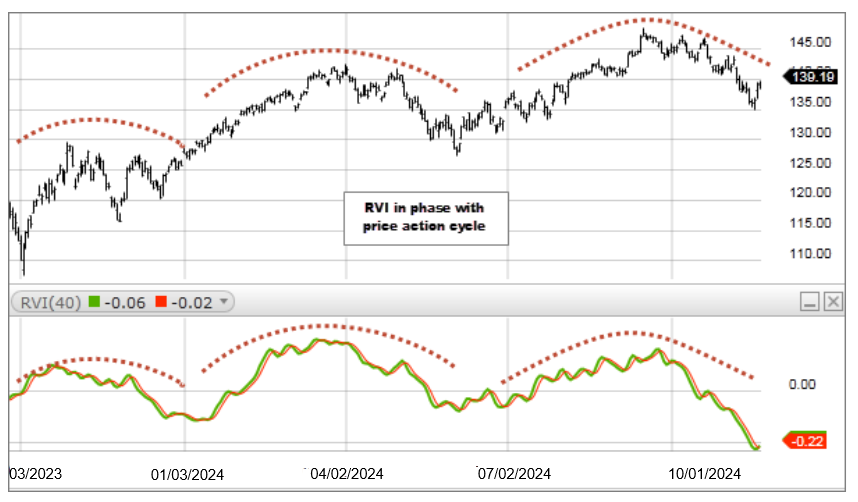
Divergence between the RVI and the price action may signal a change in trend.

In up trends potential buy opportunities occur when the RVI crosses above its signal line.
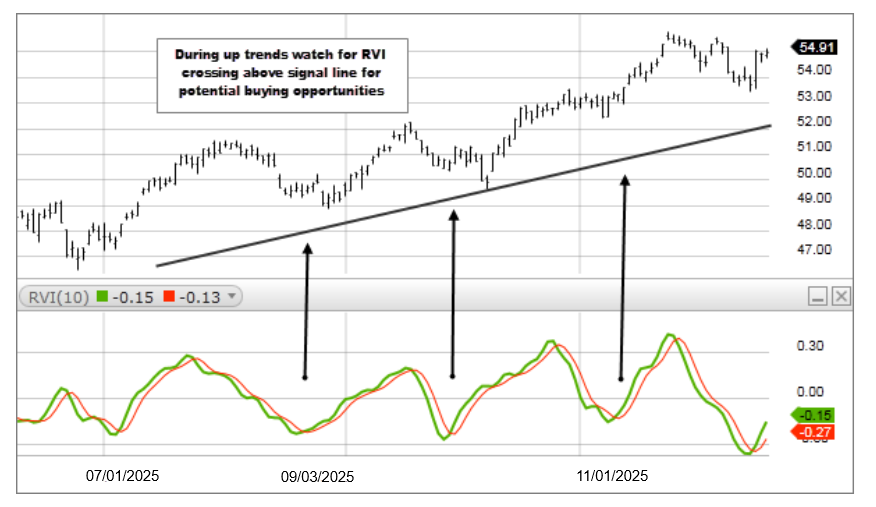
In down trends potential short sale opportunities occur when the RVI crosses below its signal line.
RVI Calculation bar a = Close – Open bar b = Close – Open one bar prior to a bar c = Close – Open one bar prior to b bar d = Close – Open one bar prior to c numerator = [ a + (2 * b) + (2 * c) + d ] / 6
e = High – Low of bar a f = High – Low of bar b g = High – Low of bar c h = High – Low of bar d denominator = [ e + (2 * f) + (2 * g) + h ] / 6
RVI = SMA of numerator for period selected / SMA of denominator for period selected
Signal Line Calculation i = RVI value one bar prior j = RVI value one bar prior to i k = RVI value one bar prior to j
Signal Line = [ RVI + (2 * i) + (2 * j) + k] / 6