
Description
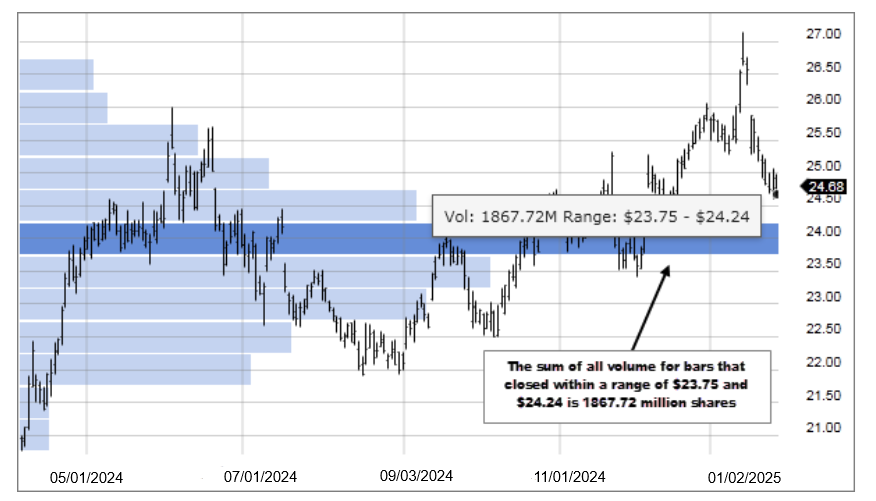
Price Volume Distribution uses horizontal bars to display the amount of volume for different price ranges. The distribution uses all of the data displayed on the chart. For example, if six months of data is visible on the chart, the price and volume for the six months displayed is used in the calculation. The calculation does not use any historical or future data that is not displayed.
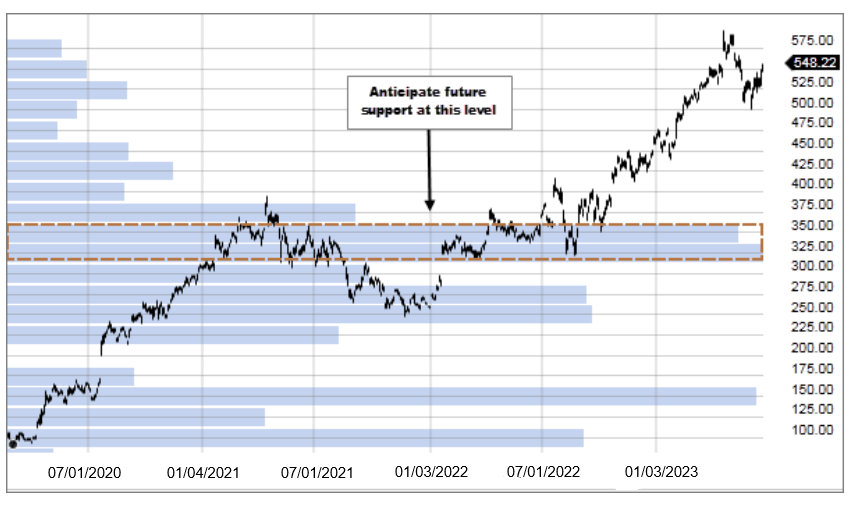
- Price ranges with heavier volume indicate more interest at those price levels. Longer horizontal bars should be monitored for possible future support/resistance
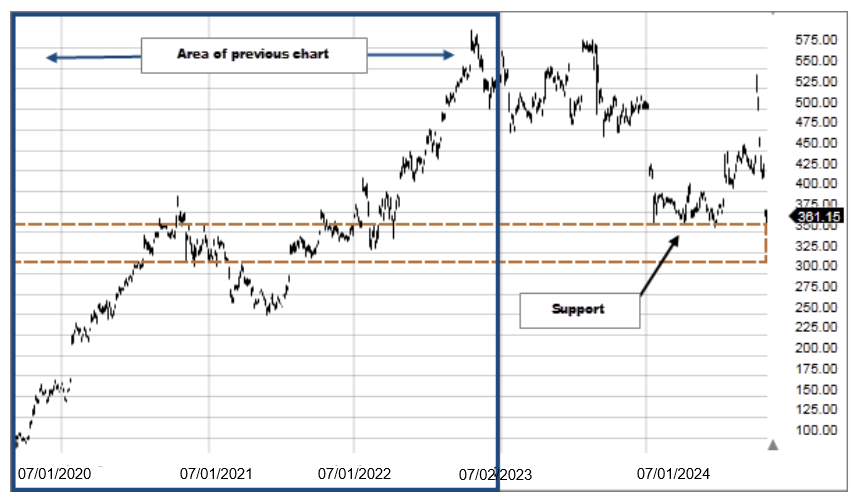
- Price breaking above a heavy volume bar indicates strength because there was enough demand to break through resistance (overcome supply)
- Price breaking below a heavy volume bar indicates weakness because there was not enough demand to overcome supply
If the closing price of a bar is within the price range of a histogram, add the volume associated with the bar to that histogram.