Description
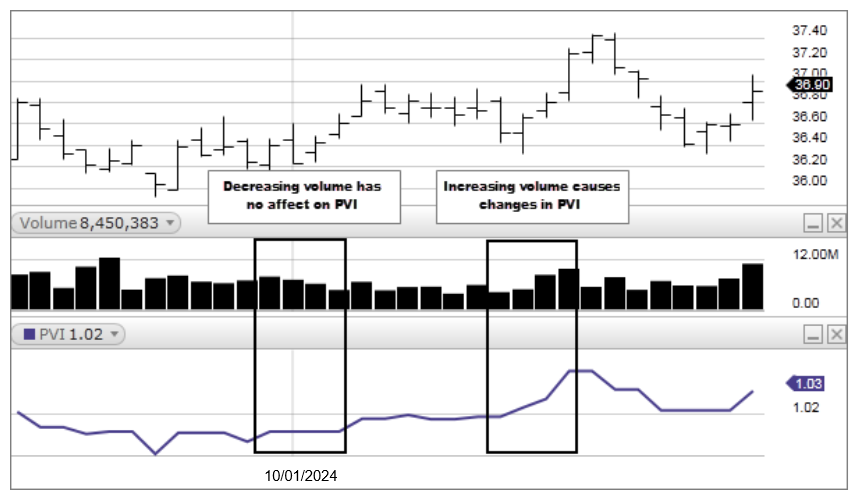
The Positive Volume Index (PVI) is often used in conjunction with the Negative Volume Index (NVI) to identify bull and bear markets. The PVI focuses on days when the volume has increased from the previous day. PVI’s premise is that the “uninformed crowd” takes positions on days when volume increases.

PVI assumes that on days when volume increases, crowd-following "uninformed" investors are entering the market. Conversely, on days with decreased volume, the "smart money" is quietly taking positions. Thus, the PVI displays what the not-so-smart-money is doing. (The Negative Volume Index (NVI), on the other hand, displays what the smart money is doing.) Note, however, that the PVI is not a contrarian indicator. Even though the PVI purports to show what the not-so-smart- money is doing, PVI still trends in the same direction as prices.
The following table summarizes NVI and PVI data from 1941 through 1975, as explained in “Stock Market Logic,” by Norman Fosback.

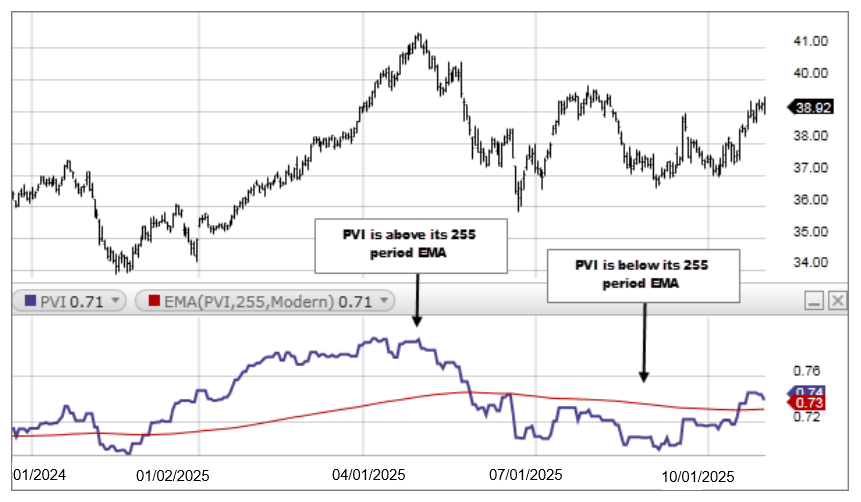
As you can see, NVI is excellent at identifying bull markets (i.e., when the NVI is above its one- year moving average) and the PVI is reliable in identifying bull markets (when the PVI is above its moving average) and bear markets (when the PVI is below its moving average).

If today’s volume is greater than yesterday’s volume then:

If today’s volume is less than or equal to yesterday’s volume then:

Because rising prices are usually associated with rising volume, the PVI usually trends upward.
