
Description
The Momentum Oscillator measures the amount that a security’s price has changed over a given period of time. The Momentum Oscillator is the current price divided by the price of a previous period, and the quotient is multiplied by 100. The result is an indicator that oscillates around 100. Values less than 100 indicate negative momentum, or decreasing price, and vice versa.
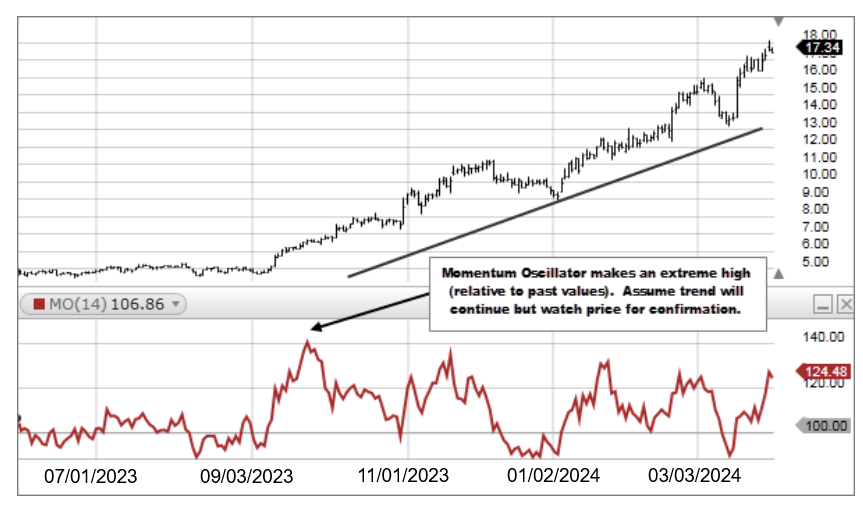
- If the Momentum Oscillator reaches extremely high or low values (relative to its historical values), you should assume a continuation of the current trend.
- Since the Momentum Oscillator does not have an upper and lower boundary you must visually inspect the history of the momentum line and draw horizontal lines along its upper and lower boundaries. When the momentum line reaches these levels it may indicate that the stock may be overbought or oversold. Note: The Momentum Oscillator is an unbound oscillator, meaning there is no upside or downside limits. This makes interpreting an overbought or oversold condition subjective. When the Momentum Oscillator is overbought the security can continue to move higher. When the Momentum Oscillator is oversold the security can continue lower as well. Use the Momentum Oscillator in conjunction with additional indicators or price analysis when attempting to read overbought or oversold conditions.
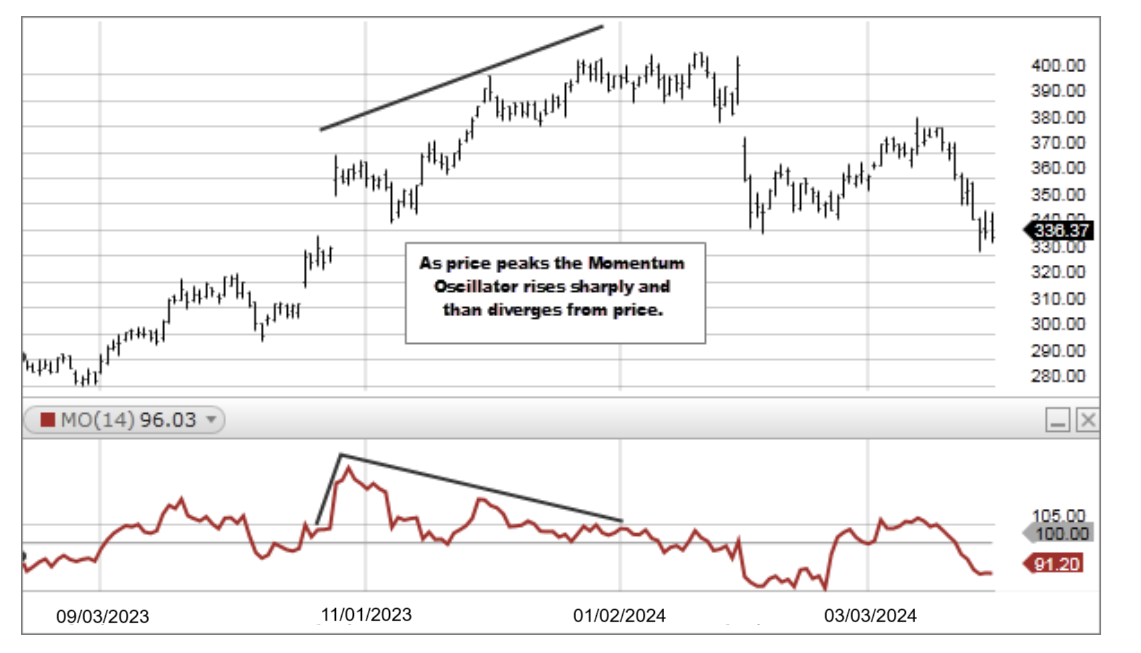
- If underlying prices make a new high or low that isn't confirmed by the Momentum Indicator, the divergence may signal a price reversal.
Momentum Oscillator = (Price today / Price n periods ago) x 100