
Description
Moving Average Envelopes are lines plotted at a certain percentage above and below a moving average of price. The default setting is a 20 period SMA with envelopes set at 5%. They are also known as trading bands, moving average bands, price envelopes, and percentage envelopes.
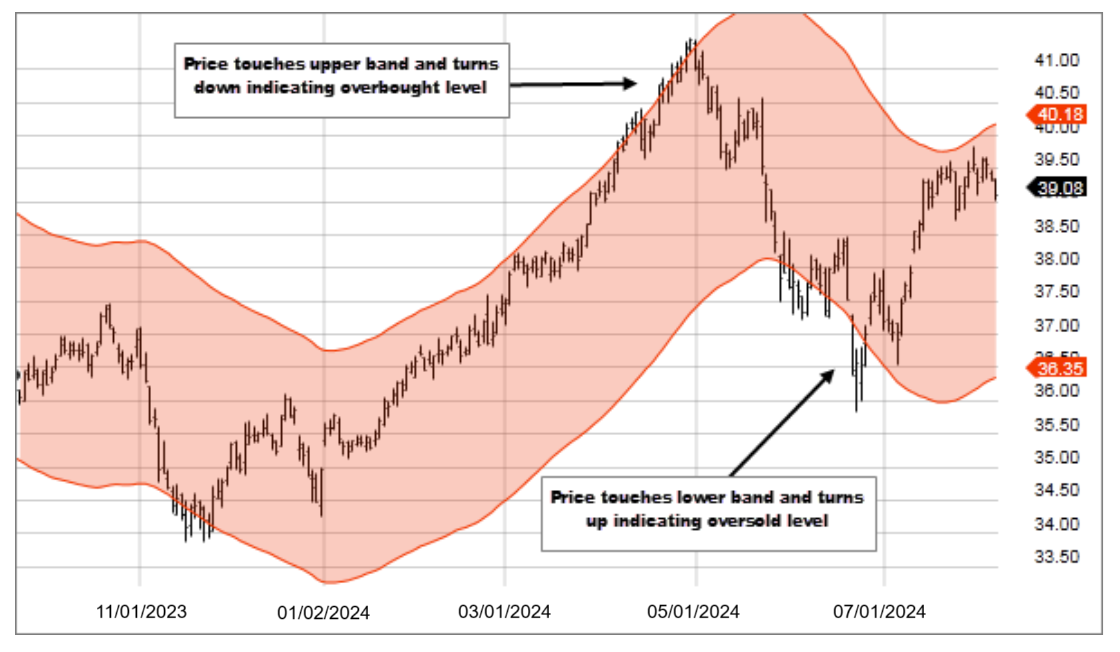
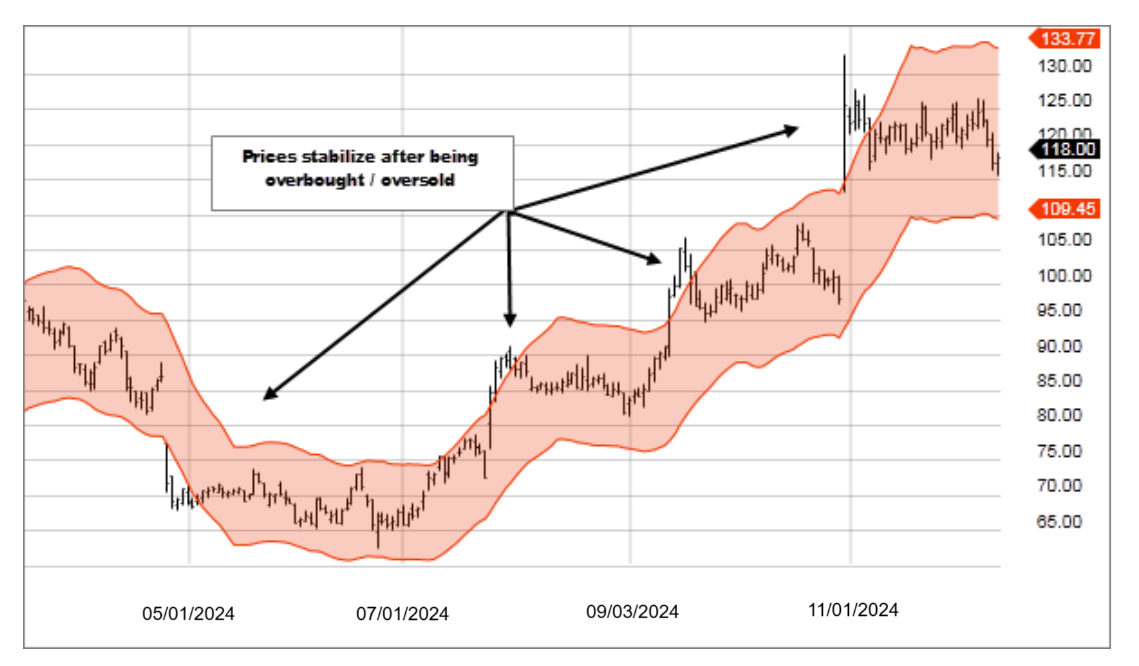
Reminiscent of Bollinger Bands®, the logic behind envelopes states that overzealous buyers and sellers push prices to extremes (i.e. the upper and lower bands), at which point the prices often stabilize by moving to more realistic levels. When the security's price touches the upper band and turns downward, the security might be at an overbought level. Conversely, when the security's price touches the lower band and turns upward, the security might be at an oversold level.
Center Band = n period SMA of the Source
Upper Band = Center Band x (1 + Envelope Percentage)
Lower Band = Center Band x (1 – Envelope Percentage)