
Description
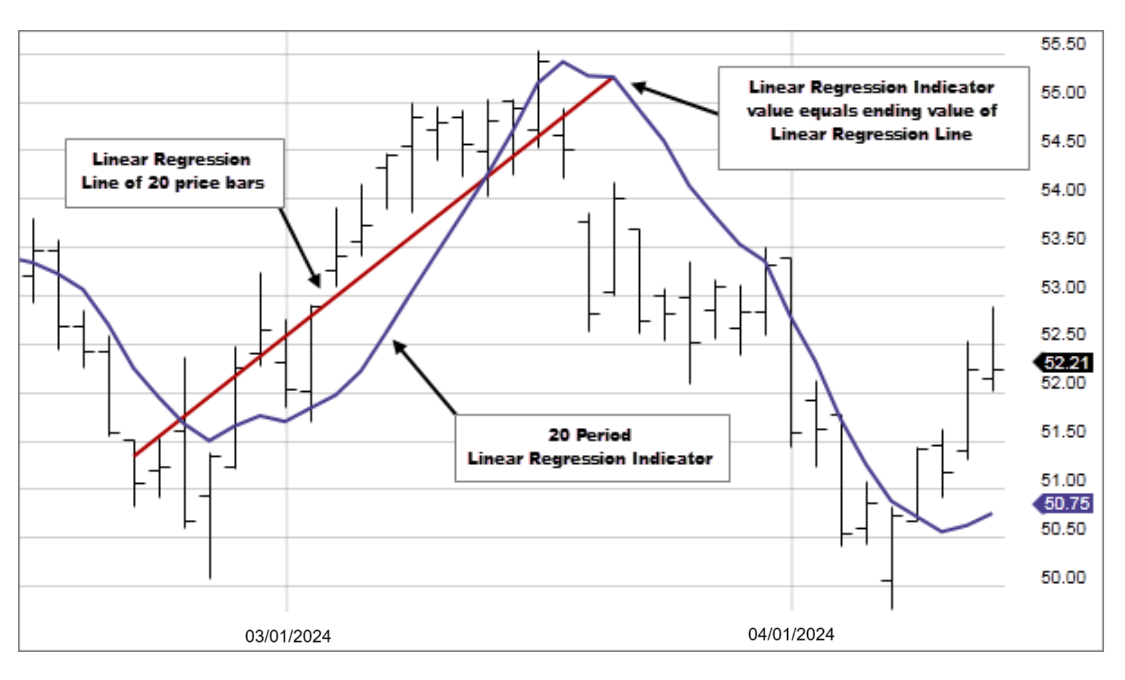
The Linear Regression Indicator plots the ending value of a Linear Regression Line for a specified number of bars; showing, statistically, where the price is expected to be. For example, a 20 period Linear Regression Indicator will equal the ending value of a Linear Regression line that covers 20 bars.
How this indicator works
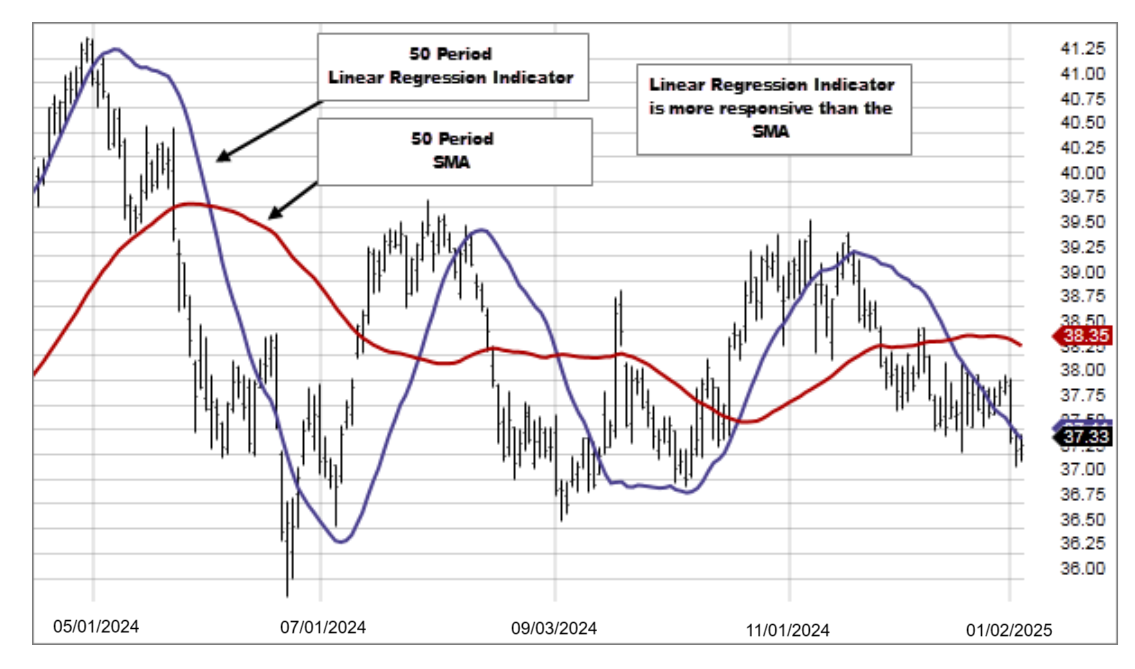
- The interpretation of the Linear Regression Indicator is similar to that of a moving average although it does have an advantage when compared to a moving average.
- Instead of plotting an average of past price action, it is plotting where a Linear Regression Line would expect the price to be, making the Linear Regression Indicator more responsive than a moving average.
Calculation
Each point in the Linear Regression Indicator is simply the end-point of an n-period Linear Regression trendline.