
Description
Keltner Bands are bands that are plotted above and below a simple moving average of average price, indicating “normal” trading ranges for markets.
The Keltner indicators take two parameters. Period 1 specifies the period to smooth highs and lows, and Period 2 specifies the period to use to smooth typical price in the calculation (see below). Note: Because Keltner Bands use average price, as well as highs minus lows, the indicator does not use a price series parameter like many other indicator functions.
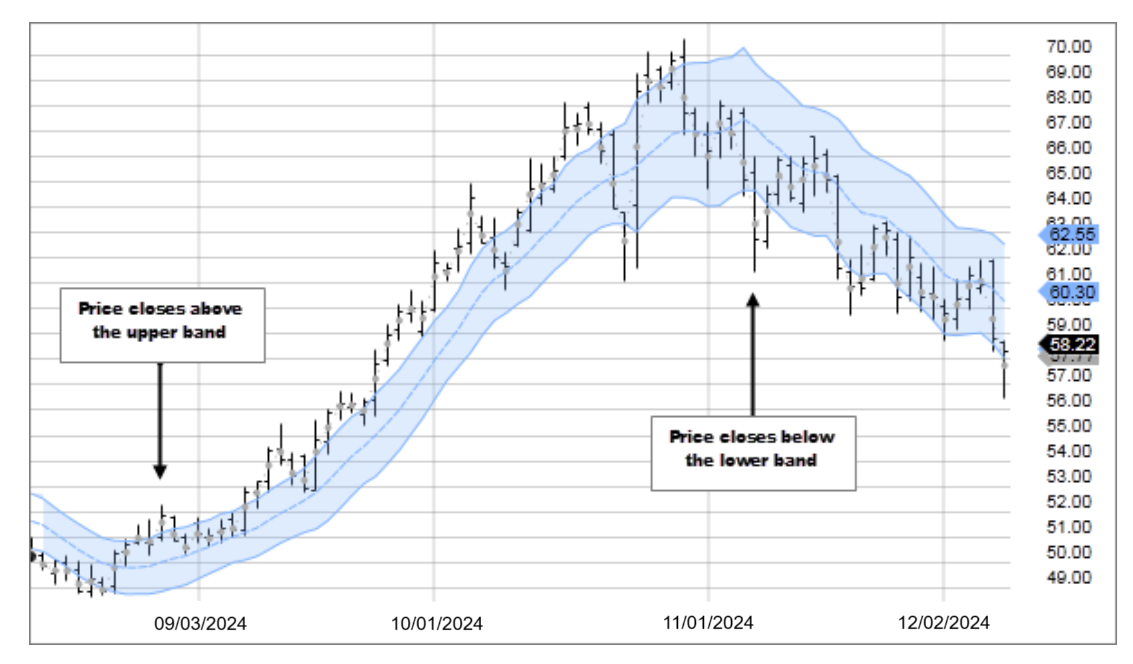
- One way to use Keltner Bands is to take a long position when price closes above the upper band, and to reverse course and take a short position when price closes below the lower band.
- Indicators based on channels, bands and envelopes are designed to encompass most price action. Therefore, price movement outside of the bands is typically considered an anomaly and, therefore, a potential trading opportunity.
Typical Price (TP) = (High + Low + Close) / 3 Band Width = Period 1 SMA of (High – Low) Center Band = Period 2 SMA of TP Upper Band = Center Band + Band Width Lower Band = Center Band – Band Width