
Description
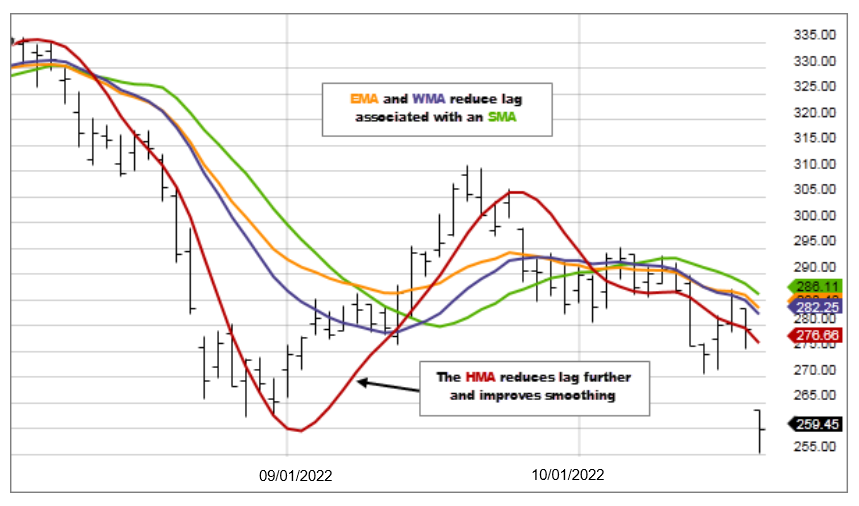
There are many types of moving averages, the most basic being the Simple Moving Average (SMA). Of all the moving averages the SMA lags price the most. The Exponential and Weighted Moving Averages were developed to address this lag by placing more emphasis on more recent data. The Hull Moving Average (HMA), developed by Alan Hull, is an extremely fast and smooth moving average. In fact, the HMA almost eliminates lag altogether and manages to improve smoothing at the same time.
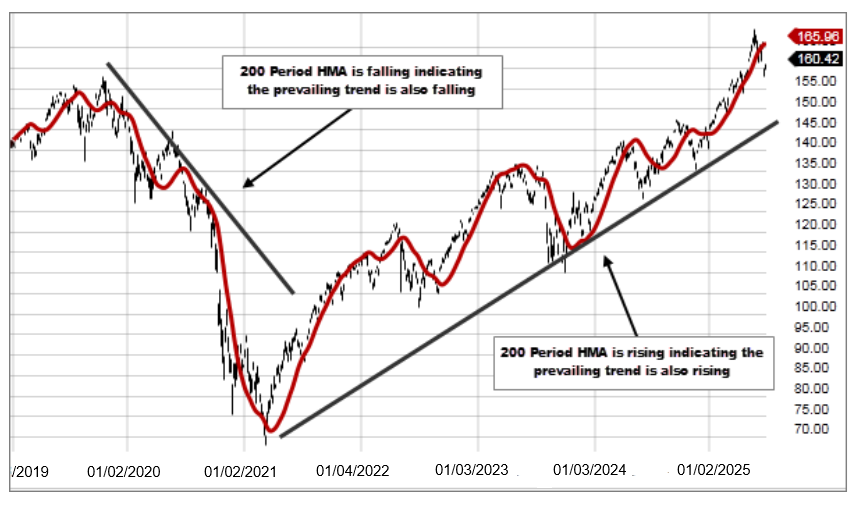
A longer period HMA may be used to identify trend. If the HMA is rising, the prevailing trend is rising, indicating it may be better to enter long positions. If the HMA is falling, the prevailing trend is also falling, indicating it may be better to enter short positions.
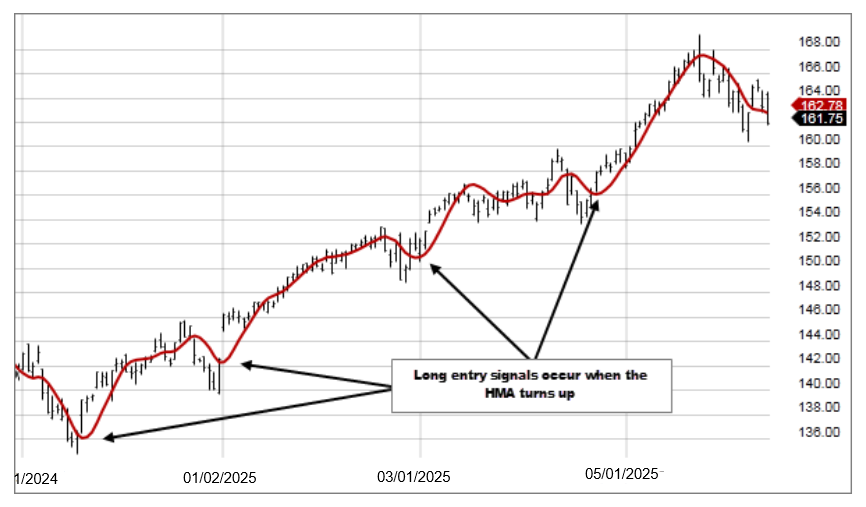
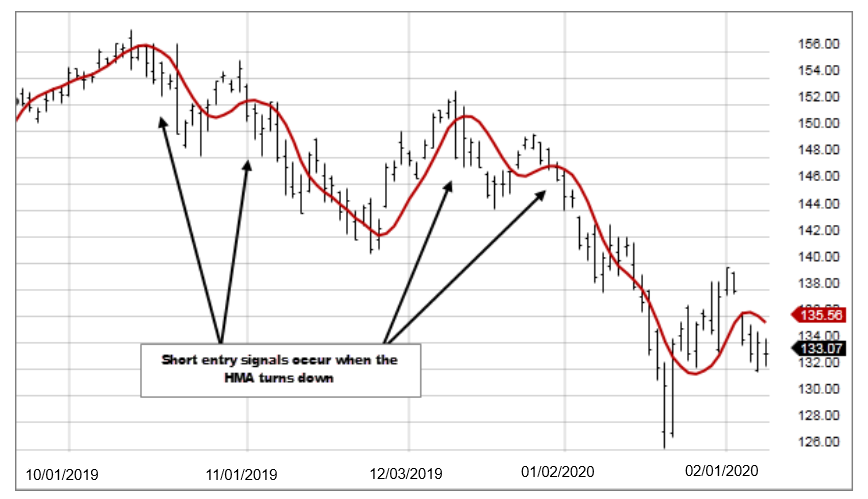
A shorter period HMA may be used for entry signals in the direction of the prevailing trend. A long entry signal, when the prevailing trend is rising, occurs when the HMA turns up and a short entry signal, when the prevailing trend is falling, occurs when the HMA turns down.
- Calculate a Weighted Moving Average with period n / 2 and multiply it by 2
- Calculate a Weighted Moving Average for period n and subtract if from step 1
- Calculate a Weighted Moving Average with period sqrt(n) using the data from step 2
HMA= WMA(2*WMA(n/2) − WMA(n)),sqrt(n))