
Description
An annualized one standard deviation of stock prices that measures how much past stock prices deviated from their average over a period of time.
How this indicator works
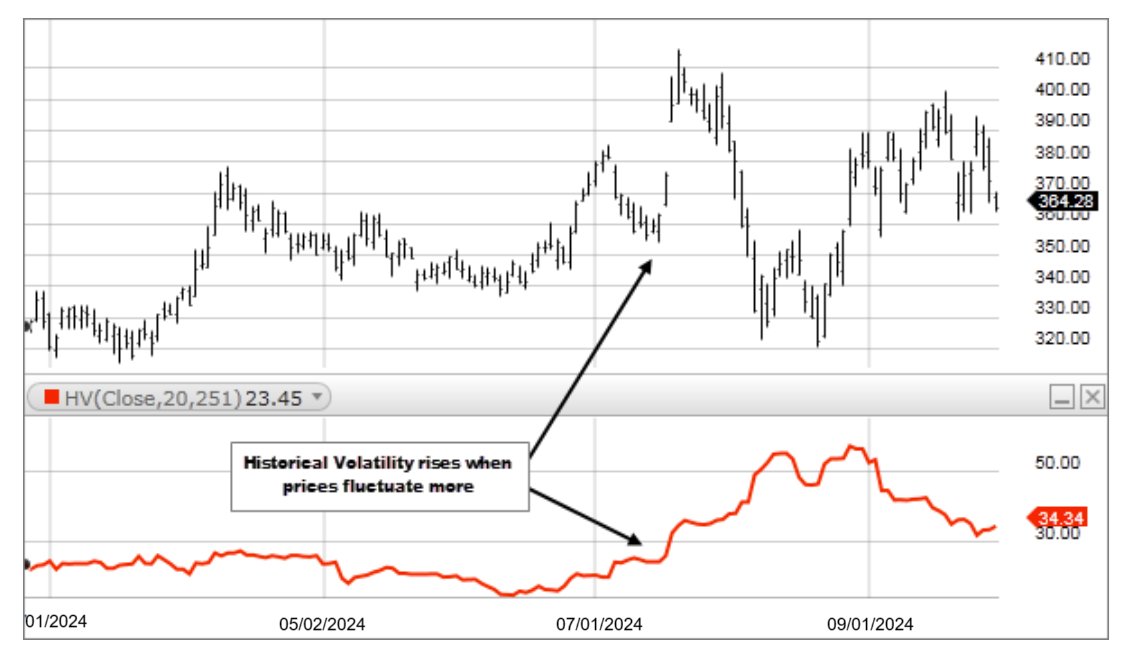
- Historical Volatility does not measure direction; it measures how much the securities price is deviating from its average.
- When a security’s Historical Volatility is rising, or higher than normal, it means prices are moving up and down farther/more quickly than usual and is an indication that something is expected to change, or has already changed, regarding the underlying security (i.e. uncertainty). You may want to research/monitor the security more closely.
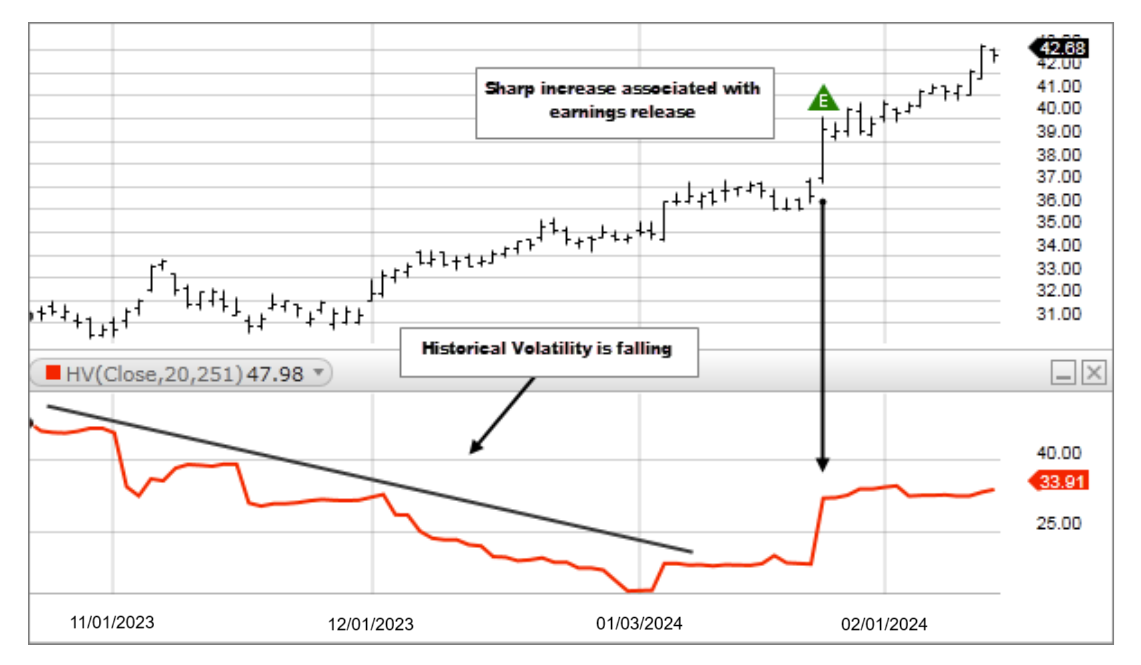
- When a security’s Historical Volatility is falling, things are returning back to normal (i.e. uncertainty has been removed).
Calculation
HV = 1 Standard Deviation
The actual calculation is:

Where:
R sub i through n = the continuously compounded return for each period
R avg = the average of all the daily returns (R sub i’s)