
Description
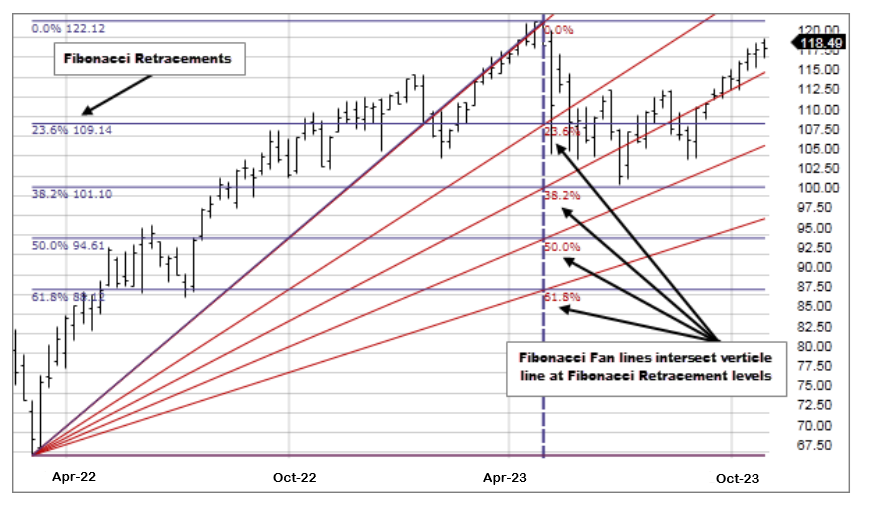
Fibonacci Fan Lines are displayed by drawing a trend line between two extreme points. Then an "invisible" vertical line, equal to the vertical distance between the extreme points, is drawn from the second extreme point to the level of the first extreme point. Four trend lines are then drawn from the first extreme point so they pass through the invisible vertical line at the Fibonacci levels of 23.6%, 38.2%, 50.0%, and 61.8%.
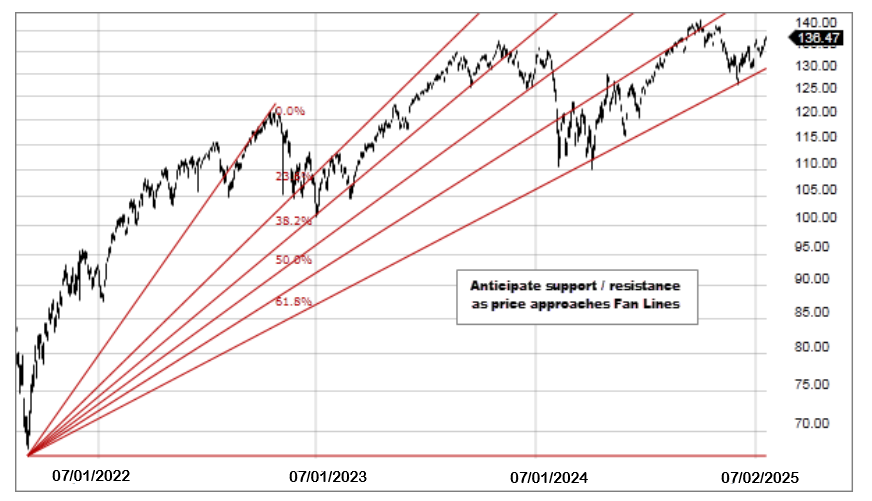
Anticipate support / resistance as price approaches Fibonacci Fan Lines.
Rising Fibonacci Fan
- Fan line 1: Drawn from extreme low through 23.6% retracement level on “invisible” vertical line
- Fan line 2: Drawn from extreme low through 38.2% retracement level on “invisible” vertical line
- Fan line 3: Drawn from extreme low through 50% retracement level on “invisible” vertical line
- Fan line 4: Drawn from extreme low through 61.8% retracement level on “invisible” line
Falling Fibonacci Fan
- Fan line 1: Drawn from extreme high through 23.6% retracement level on “invisible” vertical line
- Fan line 2: Drawn from extreme high through 38.2% retracement level on “invisible” vertical line
- Fan line 3: Drawn from extreme high through 50% low retracement level on “invisible” vertical line
- Fan line 4: Drawn from extreme high through 61.8% retracement level on “invisible” vertical line