
Description
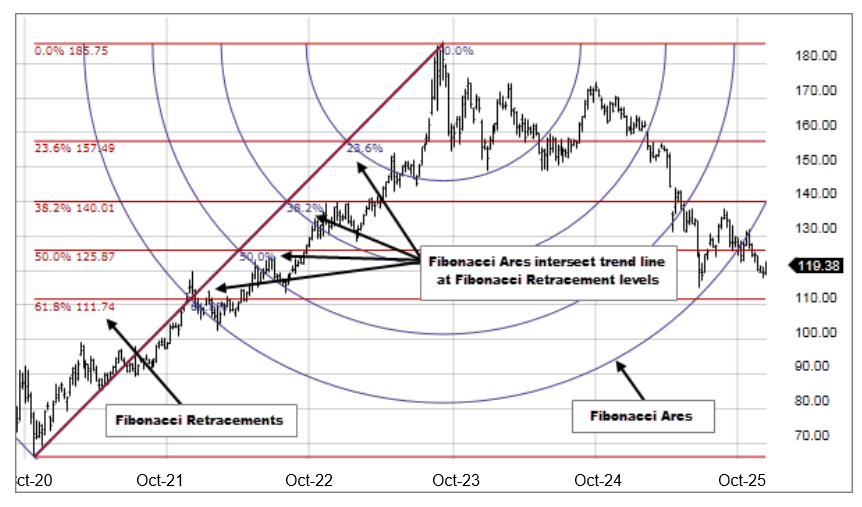
Fibonacci Arcs are half circles that extend out from a trend line drawn between two extreme points. Four arcs are then drawn, measured from the second extreme point, so they intersect the trend line at the Fibonacci levels of 23.6%, 38.2%, 50.0%, and 61.8%.These arcs mark potential support and resistance areas as prices retrace a portion of their move after a decline or an advance.
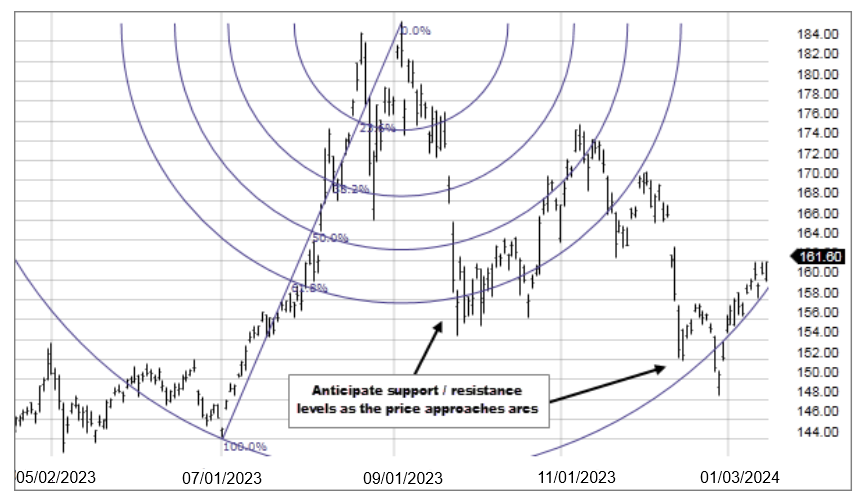
How this indicator works
Anticipate support / resistance as price approaches Fibonacci Arcs.
Calculation
- Base Line: A line from point A to point B
- First Arc: Radius = 23.6% of base line
- Second Arc: Radius = 38.2% of base line
- Third Arc: Radius = 50% of base line
- Fourth Arc: = 61.8% of base line.