
Description
The Directional Movement Index (DMI) assists in determining if a security is trending and attempts to measure the strength of the trend. The DMI disregards the direction of the security. It only attempts to determine if there is a trend and that trends strength.
The indicator is made up of four indicator lines:
- Positive Directional Indicator (+DMI) shows the difference between today’s high price and yesterday’s high price. These values are then added up from the past 14 periods and then plotted.
- Negative Directional Indicator (–DMI) shows the difference between today’s low price and yesterday’s low price. These values are then summed up from the past 14 periods and plotted.
- Average Directional Movement Index (ADX). ADX is a smoothing of the DX.
- Average Directional Movement Index Rating (ADXR) is a simple average of today’s ADX value and the ADX from 14 periods ago.
How this indicator works
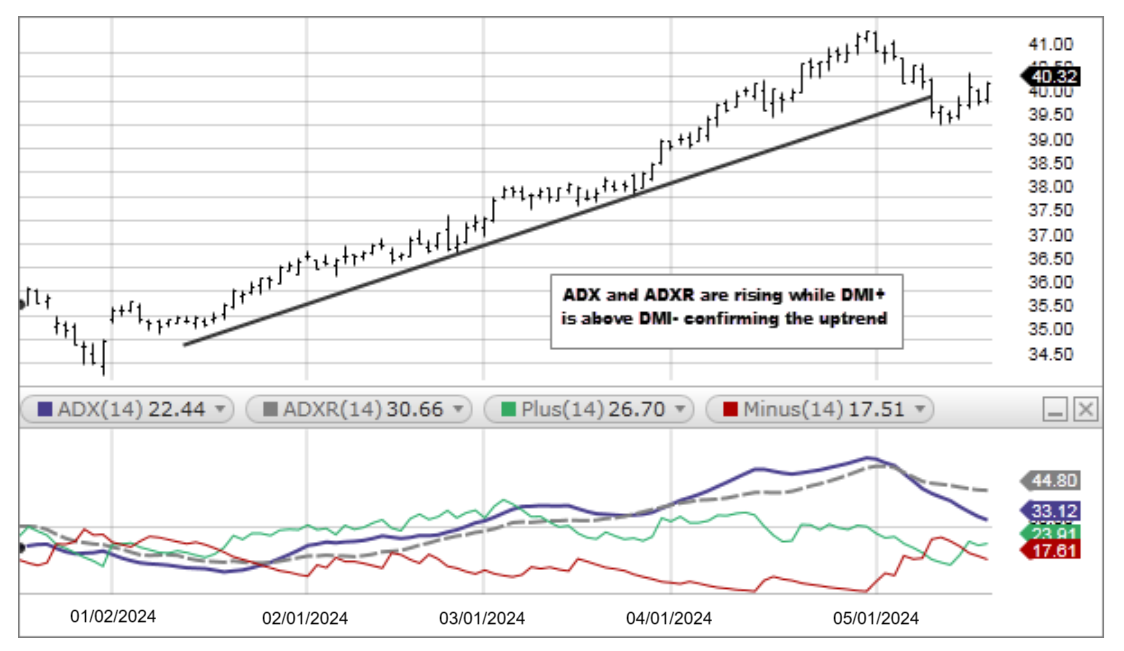
- High and rising levels of the ADX and ADXR indicate a strong trend, either up or down, signifying a trend following system may be appropriate. Typically if the ADX is above 25 it indicates a strong trend.
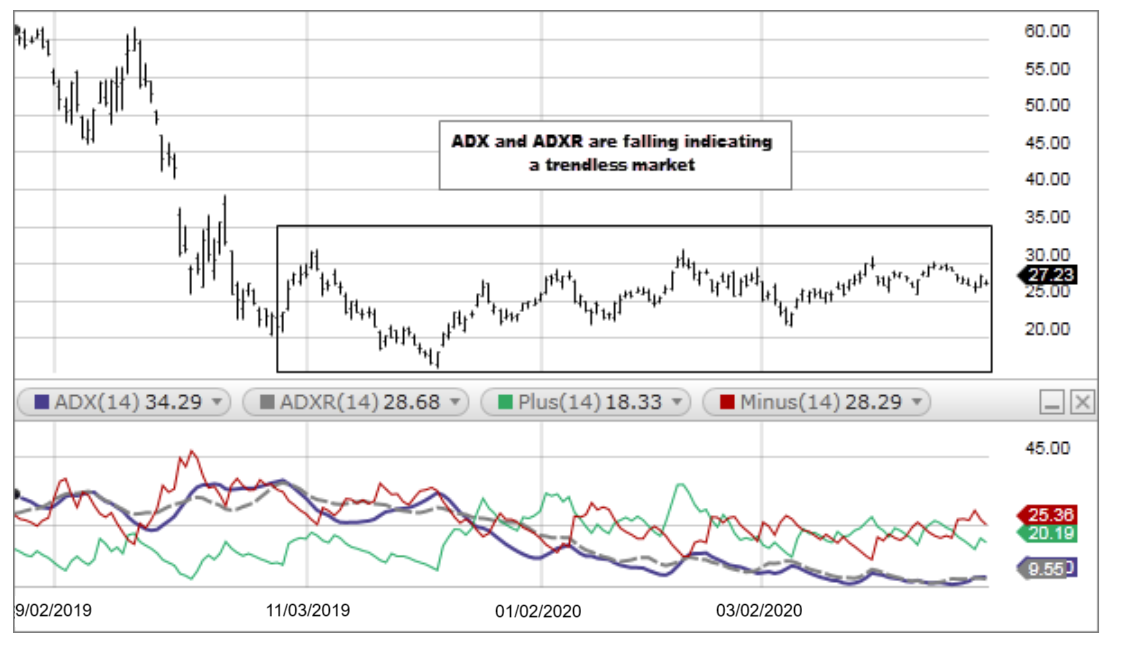
- Low and falling levels of the ADX and ADXR indicate a trendless market. Typically if the ADX is below 20 it indicates a trendless market.
- A buy signal is given when DMI+ crosses above DMI-. A sell signal is given when DMI- crosses above DMI+. The ADX and ADXR lines are then used to measure the strength of these signals.
Calculation
- Calculate the True Range, +DI, and –DI for each period: True Range is the greater of: Current High – Current Low Absolute value of Current High – Previous Close Absolute value of Current Low – Previous Close +DI IF Current High – Previous High > Previous Low – Current Low THEN +DI = the greater of Current High – Previous High OR 0 -DI IF Previous Low – Current Low > Current High – Previous High THEN –DI = the greater of Previous Low – Current Low OR 0 IF +DI AND -DI are both negative THEN both +DI and –DI = 0 IF +DI AND -DI are both positive AND +DI > -DI THEN +DI = Current High – Previous High AND –DI = 0 Else IF +DI < -DI THEN +DI = 0 AND –DI = Previous Low – Current Low
- Smooth the True Range, +DI, and –DI using Wilder’s smoothing technique.
- Divide the smoothed +DI by the smoothed True Range and multiply by 100 (this is the +DI that is plotted for the specified period).
- Divide the smoothed –DI by the smooth True Range and multiply by 100 (this is the –DI that is plotted for the specified period).
- Next calculate the Directional Movement Index (DX) which equals the (absolute value of the smoothed +DI – the smoothed –DI) /( the sum of the smoothed +DI and smoothed –DI )and multiply by 100.
- Next calculate the Average Directional Index (ADX). The first value for ADX is an average of the DX over the specified period. The following values are smoothed by multiplying the previous ADX value by the specified period – 1, adding the current DX value, and dividing this total by the period specified.
- Finally the Directional Movement Rating (ADXR) is calculated by the averaging the current ADX and the ADX value n-periods ago.