
Description
The Commodity Channel Index (CCI) measures the current price level relative to an average price level over a given period of time. CCI is relatively high when prices are far above their average. CCI is relatively low when prices are far below their average. Using this method, CCI can be used to identify overbought and oversold levels.
How this indicator works
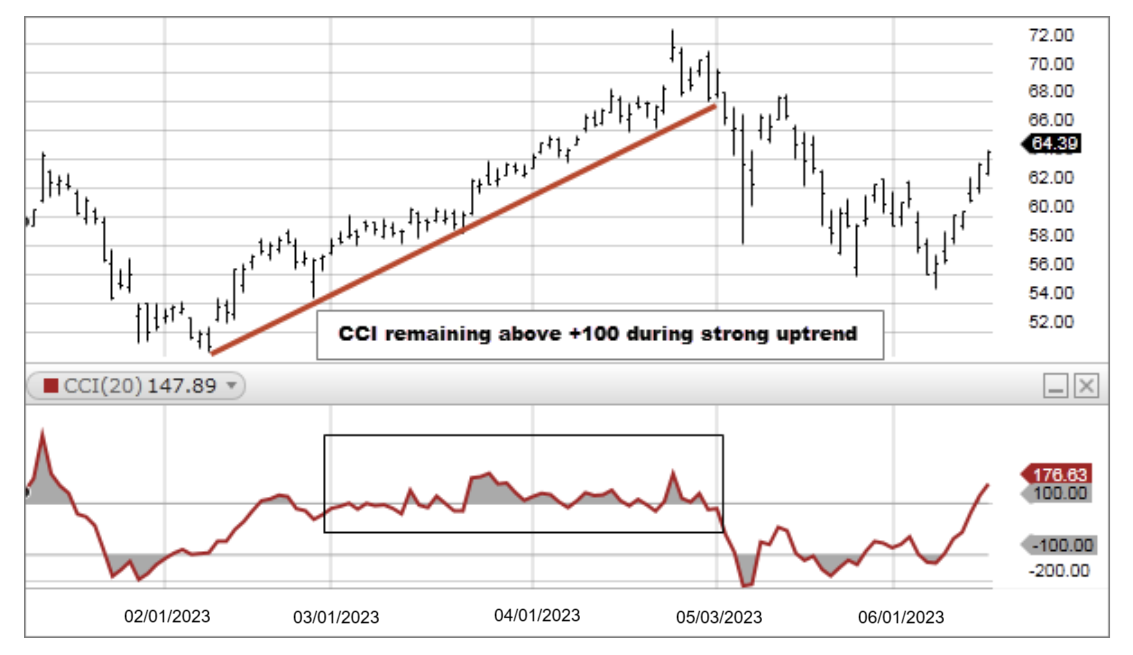
- When the CCI moves above +100, a new, strong uptrend is beginning, signaling a buy. Use trending indicators or other technical analysis methods to confirm signals indicated by the CCI.
- When the CCI moves below −100, a new, strong downtrend is beginning, signaling a sell. Close the position on CCI rising above −100. Use trending indicators or other technical analysis methods to confirm signals indicated by the CCI.
- Look for overbought levels above +100 and oversold levels below -100. These CCI levels can be adjusted depending on the volatility of the security. For example, for a more volatile security you can use +200 and -200.
Note: CCI is an unbound oscillator, meaning there is no upside or downside limits. This makes interpreting an overbought or oversold condition subjective. When the CCI is overbought the security can continue to move higher. When the CCI is oversold the security can continue lower as well. Use the CCI in conjunction with additional indicators or price analysis when attempting to read overbought or oversold conditions.
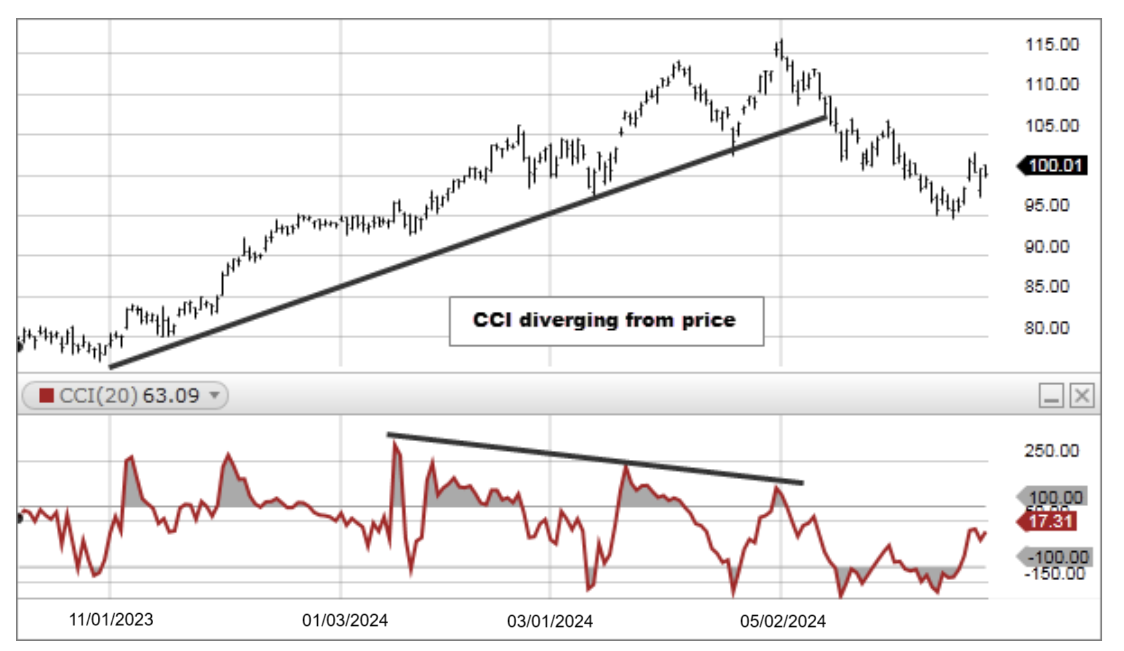
- If underlying prices make a new high or low that isn't confirmed by the CCI, the divergence may signal a price reversal.
Calculation
The Commodity Channel Index (CCI) is calculated by determining the difference between the mean price of a security and the average of the means over the period chosen. This difference is compared to the average difference over the time period. Comparing the differences of the averages allows for the commodities volatility. The result is multiplied by a constant to ensure that most values fall within the standard range of +/- 100.
CCI = (AveP - SMA_of_AveP) / (0.015 * Mean Deviation)
Where: CCI = Commodity Channel Index AveP = Average Price = (High + Low + Close) / 3 (Also known as the Typical Price)
The 0.015 constant ensures 70 to 80 percent of CCI values fall within the +100 to -100 range.