CBOE NASDAQ Market Volatility Index (VXN)

Description

The CBOE NASDAQ Market Volatility (VXN) is a measure of implied volatility, based on the prices of a basket of NASDAQ 100 Index options with 30 days to expiration.

Chart: CBOE NASDAQ Market Volatility Index (VXN)

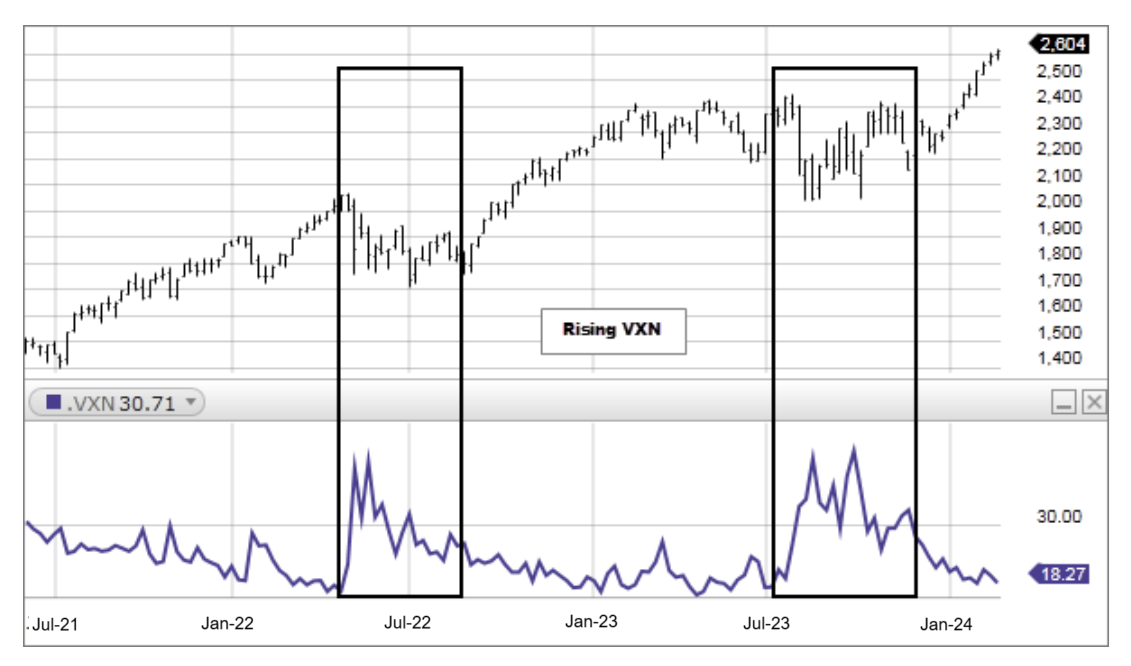
How this indicator works

  • A rising VXN indicates that traders expect the NASDAQ 100 Index to become more volatile.
  • The higher the VXN, the higher the fear, which, according to market contrarians, is considered a buy signal.
  • A falling VXN indicates that traders in the options market expect the NASDAQ 100 Index to trade more quietly.
  • In the same respect, the lower the VXN, the lower the fear which indicates a more complacent market.

Calculation

n/a

Technical analysis focuses on market action — specifically, volume and price. Technical analysis is only one approach to analyzing stocks. When considering which stocks to buy or sell, you should use the approach that you're most comfortable with. As with all your investments, you must make your own determination as to whether an investment in any particular security or securities is right for you based on your investment objectives, risk tolerance, and financial situation. Past performance is no guarantee of future results.

688707.3.0