
Description
The Money Flow Index (MFI) is a momentum indicator that measures the flow of money into and out of a security over a specified period of time. It is related to the Relative Strength Index (RSI) but incorporates volume, whereas the RSI only considers price. The MFI is calculated by accumulating positive and negative Money Flow values (see Money Flow), then creating a Money Ratio. The Money Ratio is then normalized into the MFI oscillator form.
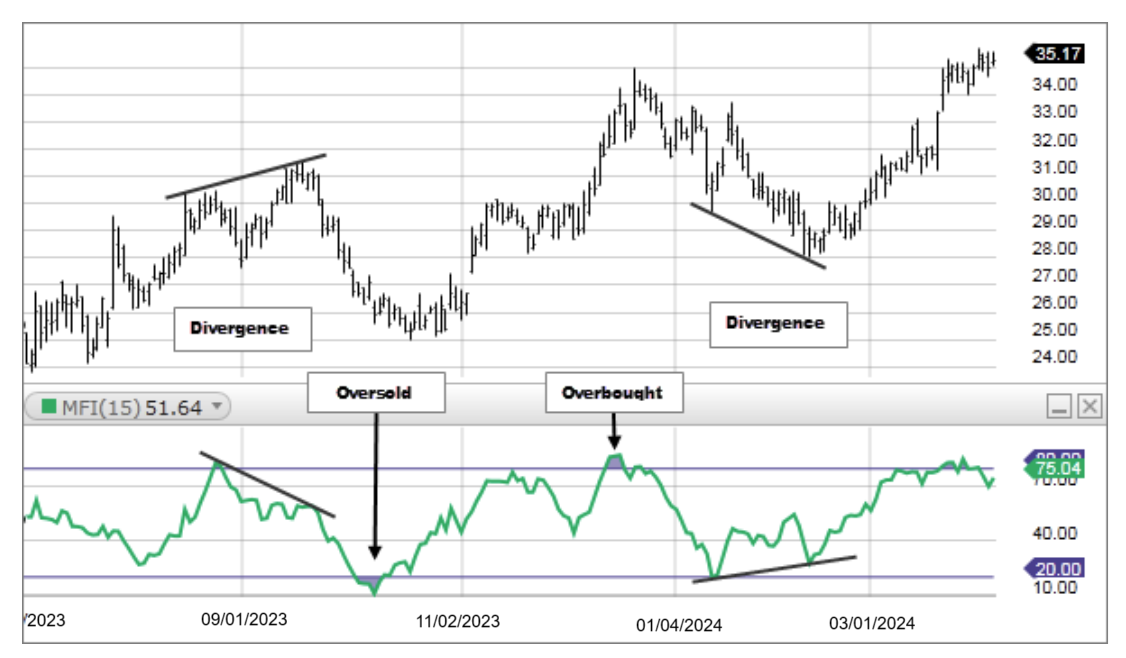
- Oversold levels typically occur below 20 and overbought levels typically occur above 80. These levels may change depending on market conditions. Level lines should cut across the highest peaks and the lowest troughs. Oversold/Overbought levels are generally not reason enough to buy/sell; and traders should consider additional technical analysis or research to confirm the security's turning point. Keep in mind, during strong trends, the MFI may remain overbought or oversold for extended periods.
- If the underlying price makes a new high or low that isn't confirmed by the MFI, this divergence can signal a price reversal.
The Money Flow Index requires a series of calculations.
- First, the period's Typical Price is calculated. Typical Price = (High + Low + Close)/3
- Next, Money Flow (not the Money Flow Index) is calculated by multiplying the period's Typical Price by the volume. Money Flow = Typical Price * Volume
- If today's Typical Price is greater than yesterday's Typical Price, it is considered Positive Money Flow. If today's price is less, it is considered Negative Money Flow.
- Positive Money Flow is the sum of the Positive Money over the specified number of periods. Negative Money Flow is the sum of the Negative Money over the specified number of periods.
- The Money Ratio is then calculated by dividing the Positive Money Flow by the Negative Money Flow. Money Ratio = Positive Money Flow / Negative Money Flow
- Finally, the Money Flow Index is calculated using the Money Ratio.