2025 is looking like another year for the record books. Stocks are near all-time highs. Gold surged well past $4,000 for the first time ever. Bitcoin swelled beyond $123,000 (although it has retraced back toward $90,000 since then). And the year isn't done yet.
Here were some of the biggest stock market chart trends that came into view this year—and might provide clues for what to expect in 2026.
A golden picture
As of mid-December, the S&P 500 has gained roughly 15% year to date. Barring a late-December collapse, this would mark the third straight year of double-digit percentage gains for the US market. A look at the charts shows that, since a late-winter swoon earlier this year, stocks took a staircase to record highs. And a widely used chart pattern—moving average crossovers—may have helped uncover the bullish trend that played out during the year.
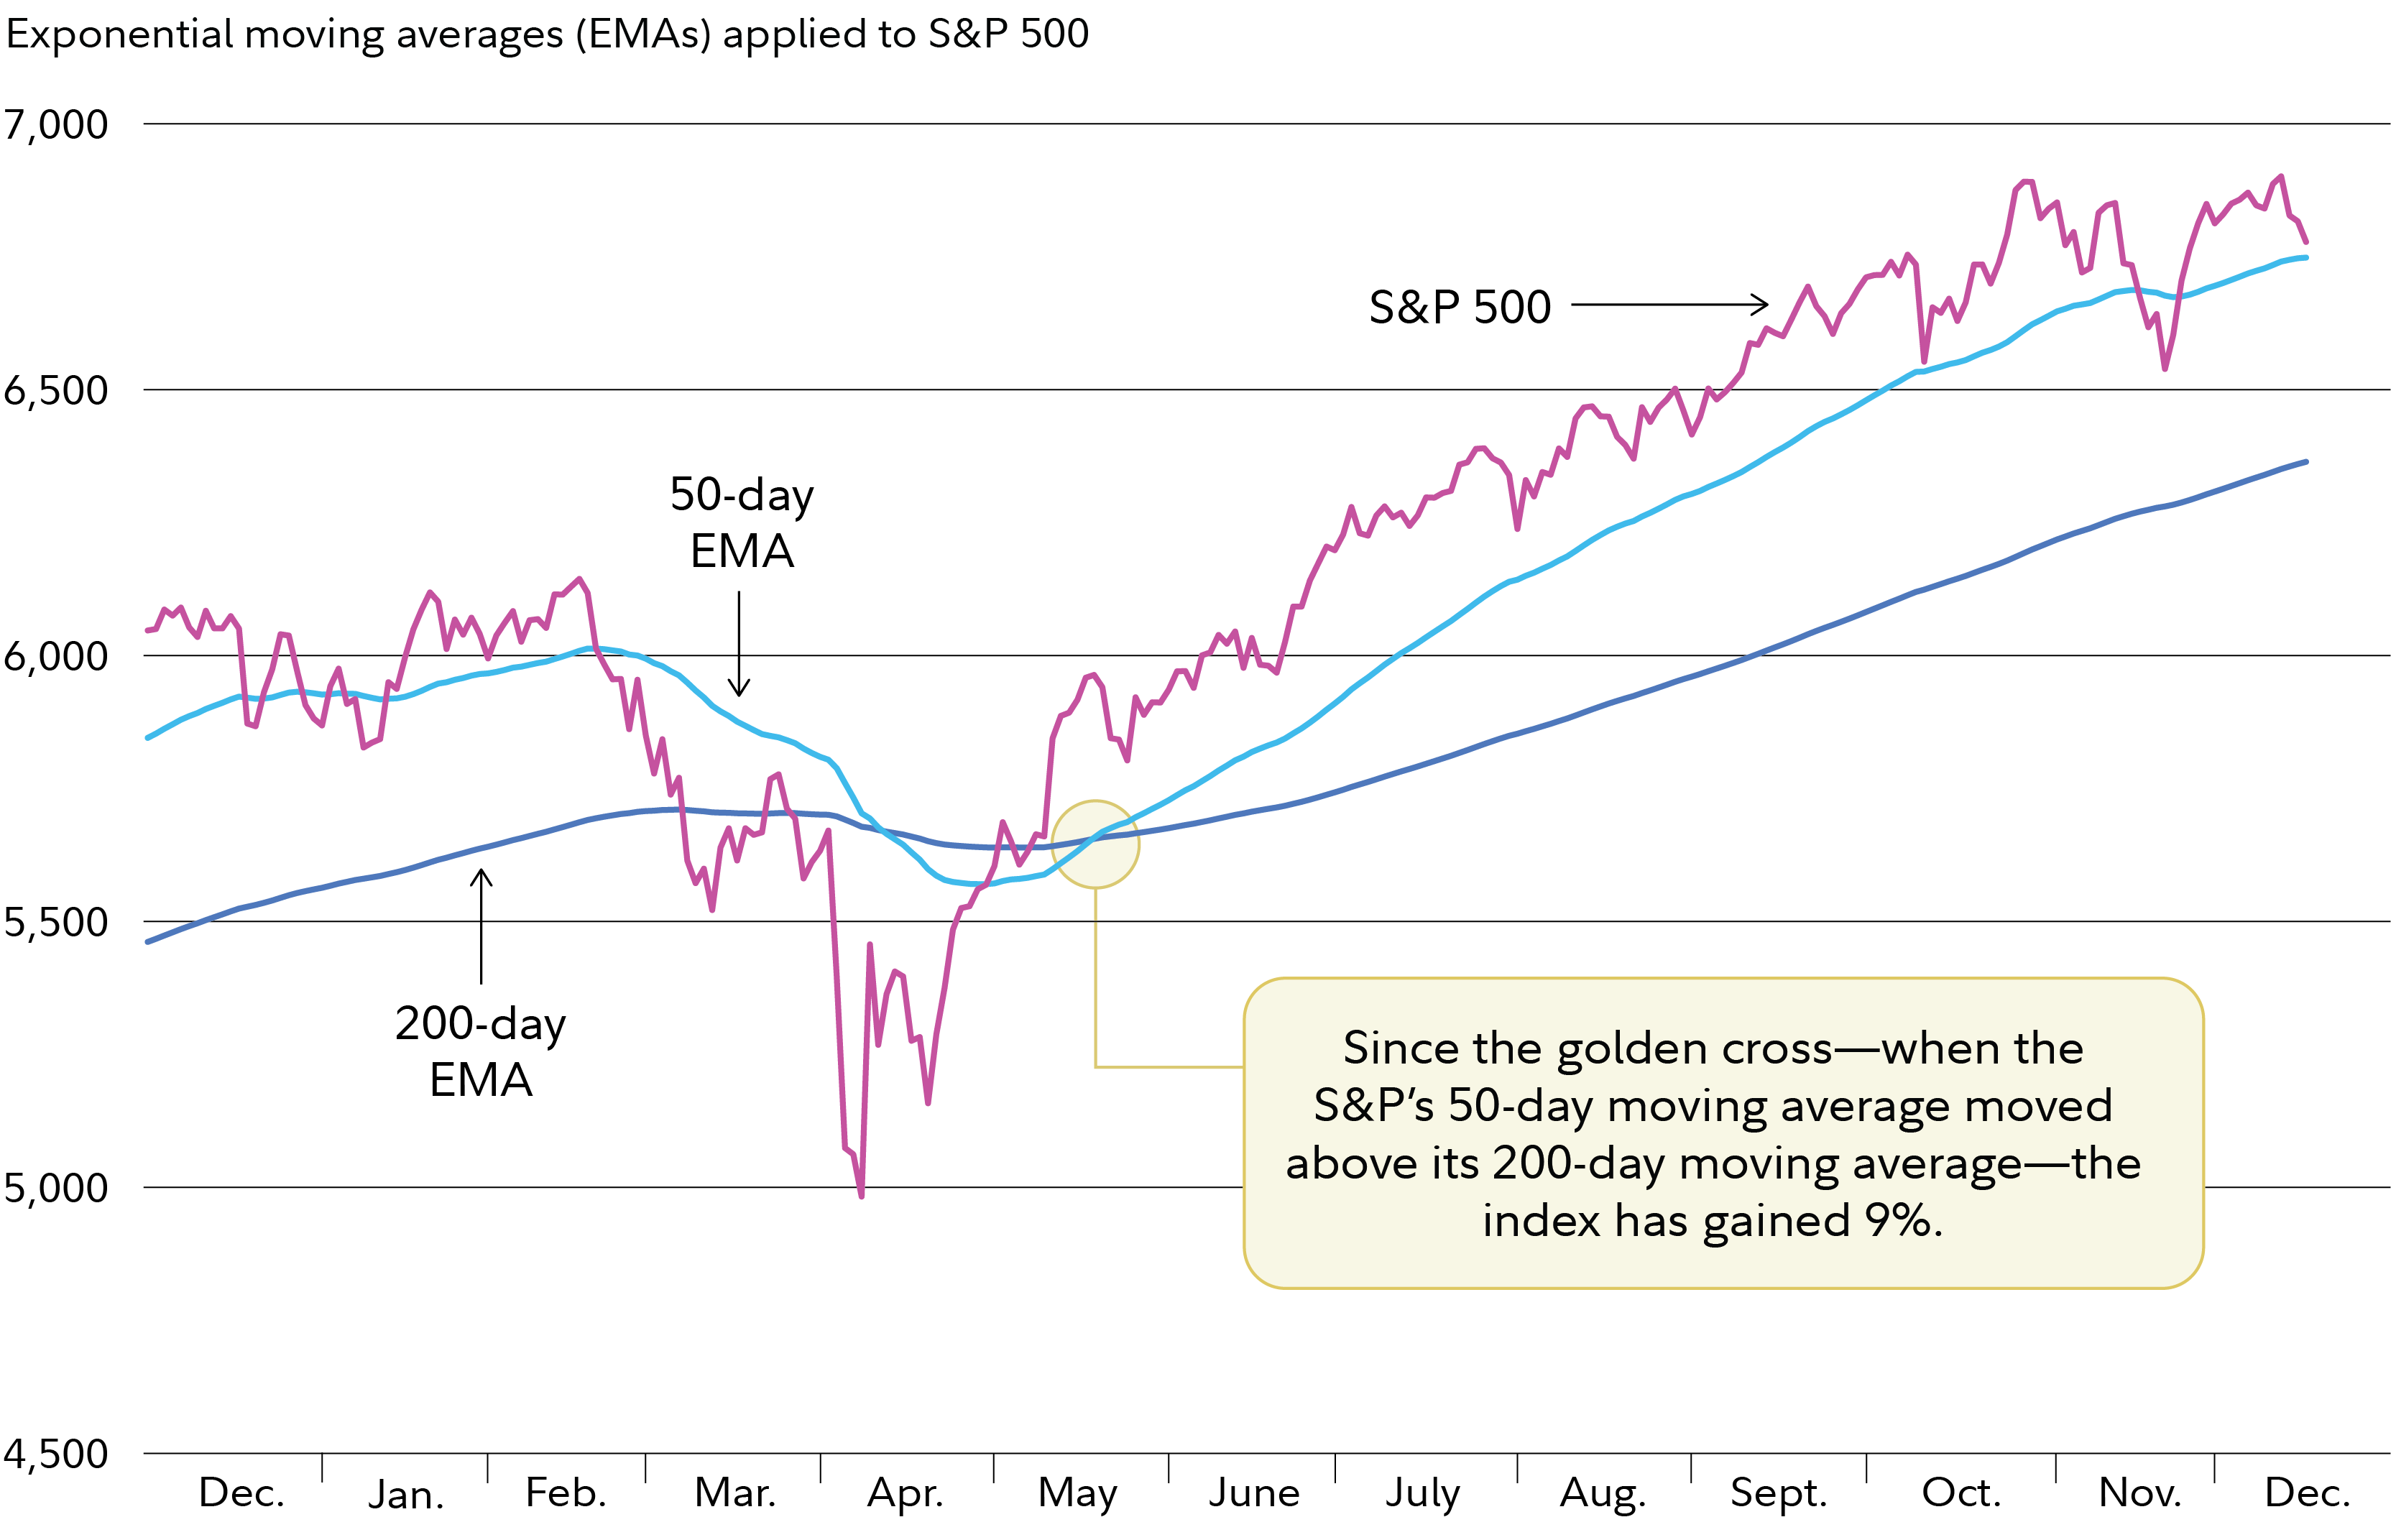
Moving average crossovers are among the most powerful signals that chart users look for. There were 2 noteworthy crossover signals this year: a short-lived “death cross” quickly followed by a “golden cross” that remains intact.
Crossover signals involve buying or selling when a shorter moving average crosses a longer moving average. A buy signal is generated when a shorter-term moving average crosses above a longer-term moving average. For example, the golden cross occurs when the 50-day exponential moving average crosses above a 200-day moving average. Alternatively, a sell signal (i.e., a death cross) is generated when a short moving average crosses below a long moving average.
In early April, a death cross occurred when the S&P 500’s 50-day moving average crossed below the 200-day moving average—generating a sell signal. However, this signal did not last long amid the onset of global trade disputes in the spring of 2025 that led to unusually volatile trading.
That’s because, in mid-May, the S&P 500’s 50-day moving average crossed back above the 200-day moving average—generating a buy signal. Since this golden cross, stocks have gained roughly 9%.

Currently, the 50-day exponential moving average remains well above the 200-day exponential moving average. Consequently, the possibility of a death cross (i.e., a sell signal) appears not to be imminent. Heading into 2026, active investors may want to monitor this widely followed crossover signal if stocks exhibit some weakness, as they have begun to over the past month or so.
Another indicator that chart users consider to help forecast which direction stocks may go is the January barometer—which has accurately predicted how stocks will perform multiple years in a row. For the 3rd consecutive year, stocks climbed this past January. If stocks stay on their positive pace through year end, it will be the 3rd consecutive year of gains. Chart users might want to weigh this coming January's market performance to assess whether 2025's momentum spills over into the new year.
Oil paints a bullish picture
AI and big tech have often been attributed as the main market driver for stock gains in 2025. However, falling oil prices may have played a more meaningful role across the market.
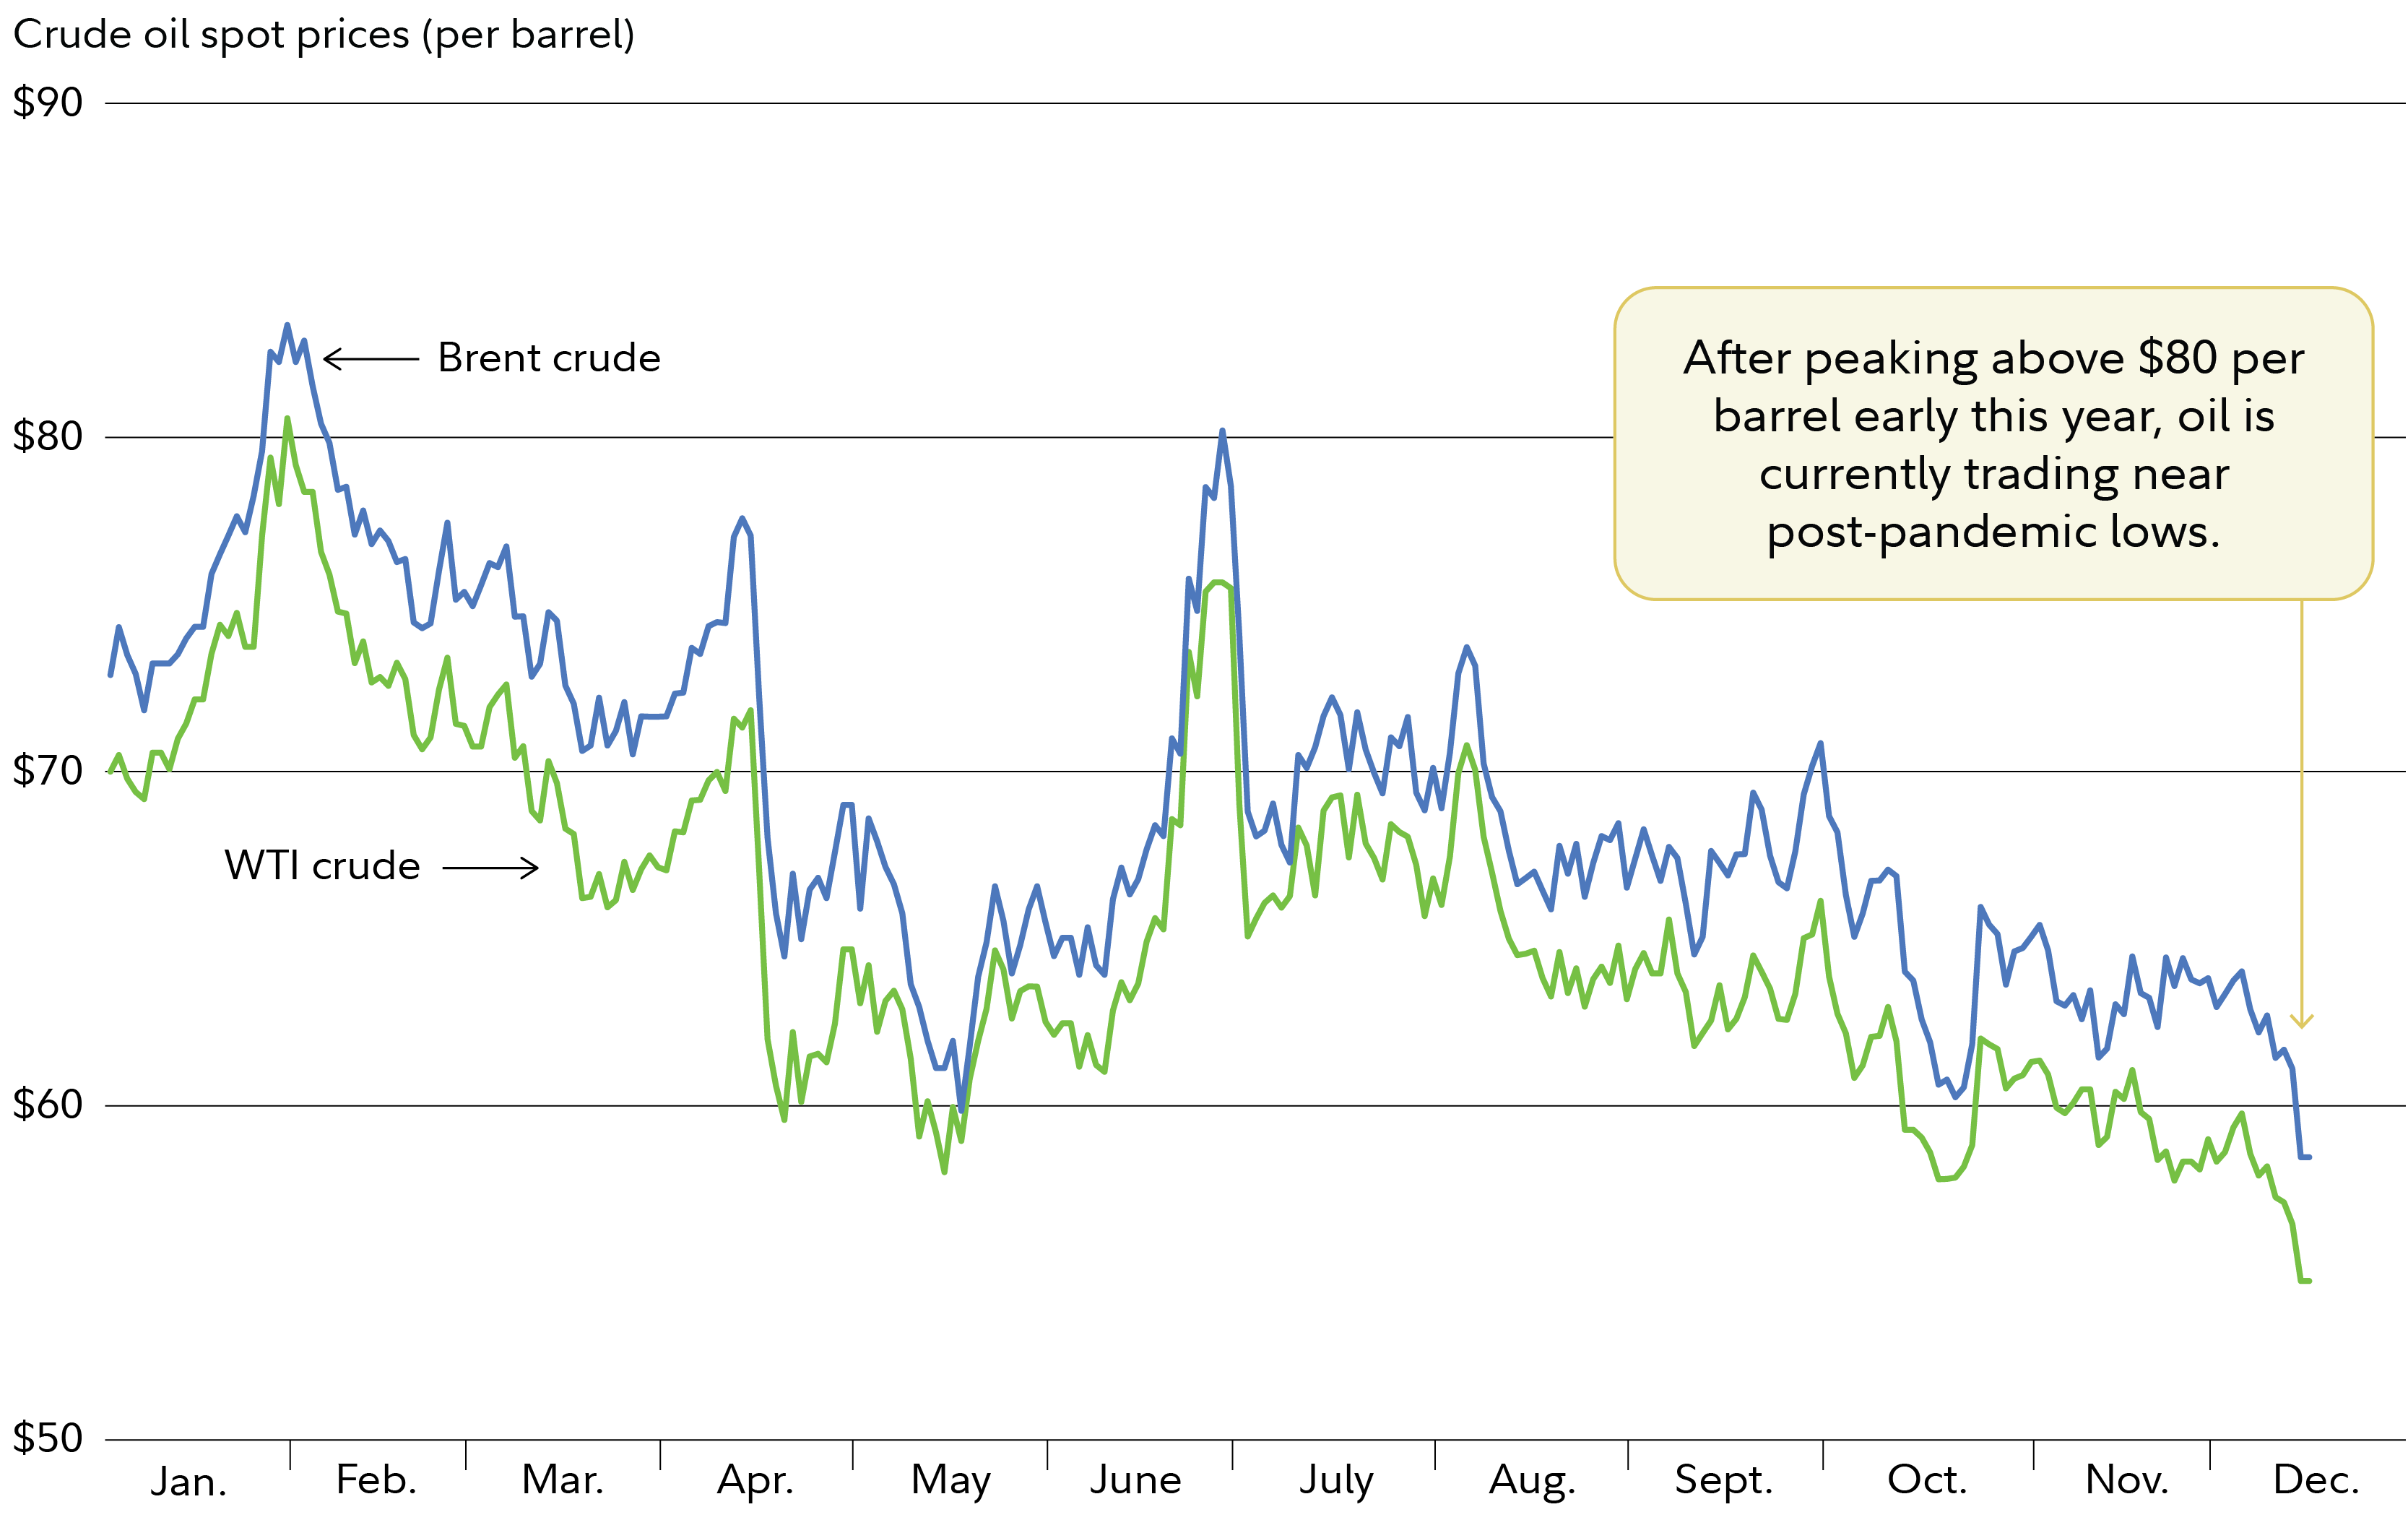
While prices have surged for a range of other commodities including gold, silver, copper, lithium, live cattle, and coffee—reaching record highs in some cases—oil prices have plummeted. Excluding a temporary spike in June, oil prices have dropped from a peak above $80 per barrel earlier in the year to below $60 per barrel and are currently trading near post-pandemic lows.

A big reason for the decline in oil prices this year is that the marginal cost of discovering, producing, and transporting a barrel of crude oil has been falling. This is due largely to more US shale sources and increasing efficiencies procuring them. That’s a big reason why, despite several geopolitical events that have caused some temporary price shocks this year, the overall price trend has been down.
The impact of the relative price of oil can’t be overstated. Oil prices are not only a major cost for industries like airlines and transportation but are also important for consumer industries and others. The lower the price of oil, the less consumers need to spend on gas and heating oil. Consequently, that enables more disposable income for, say, purchasing staples and discretionary sector items.
Recently, oil prices have rebounded slightly from multiyear lows due to tensions in Venezuela. This, as well as other geopolitical developments, could have an impact on oil prices and is a factor to watch in the new year.
Market breadth strengthens
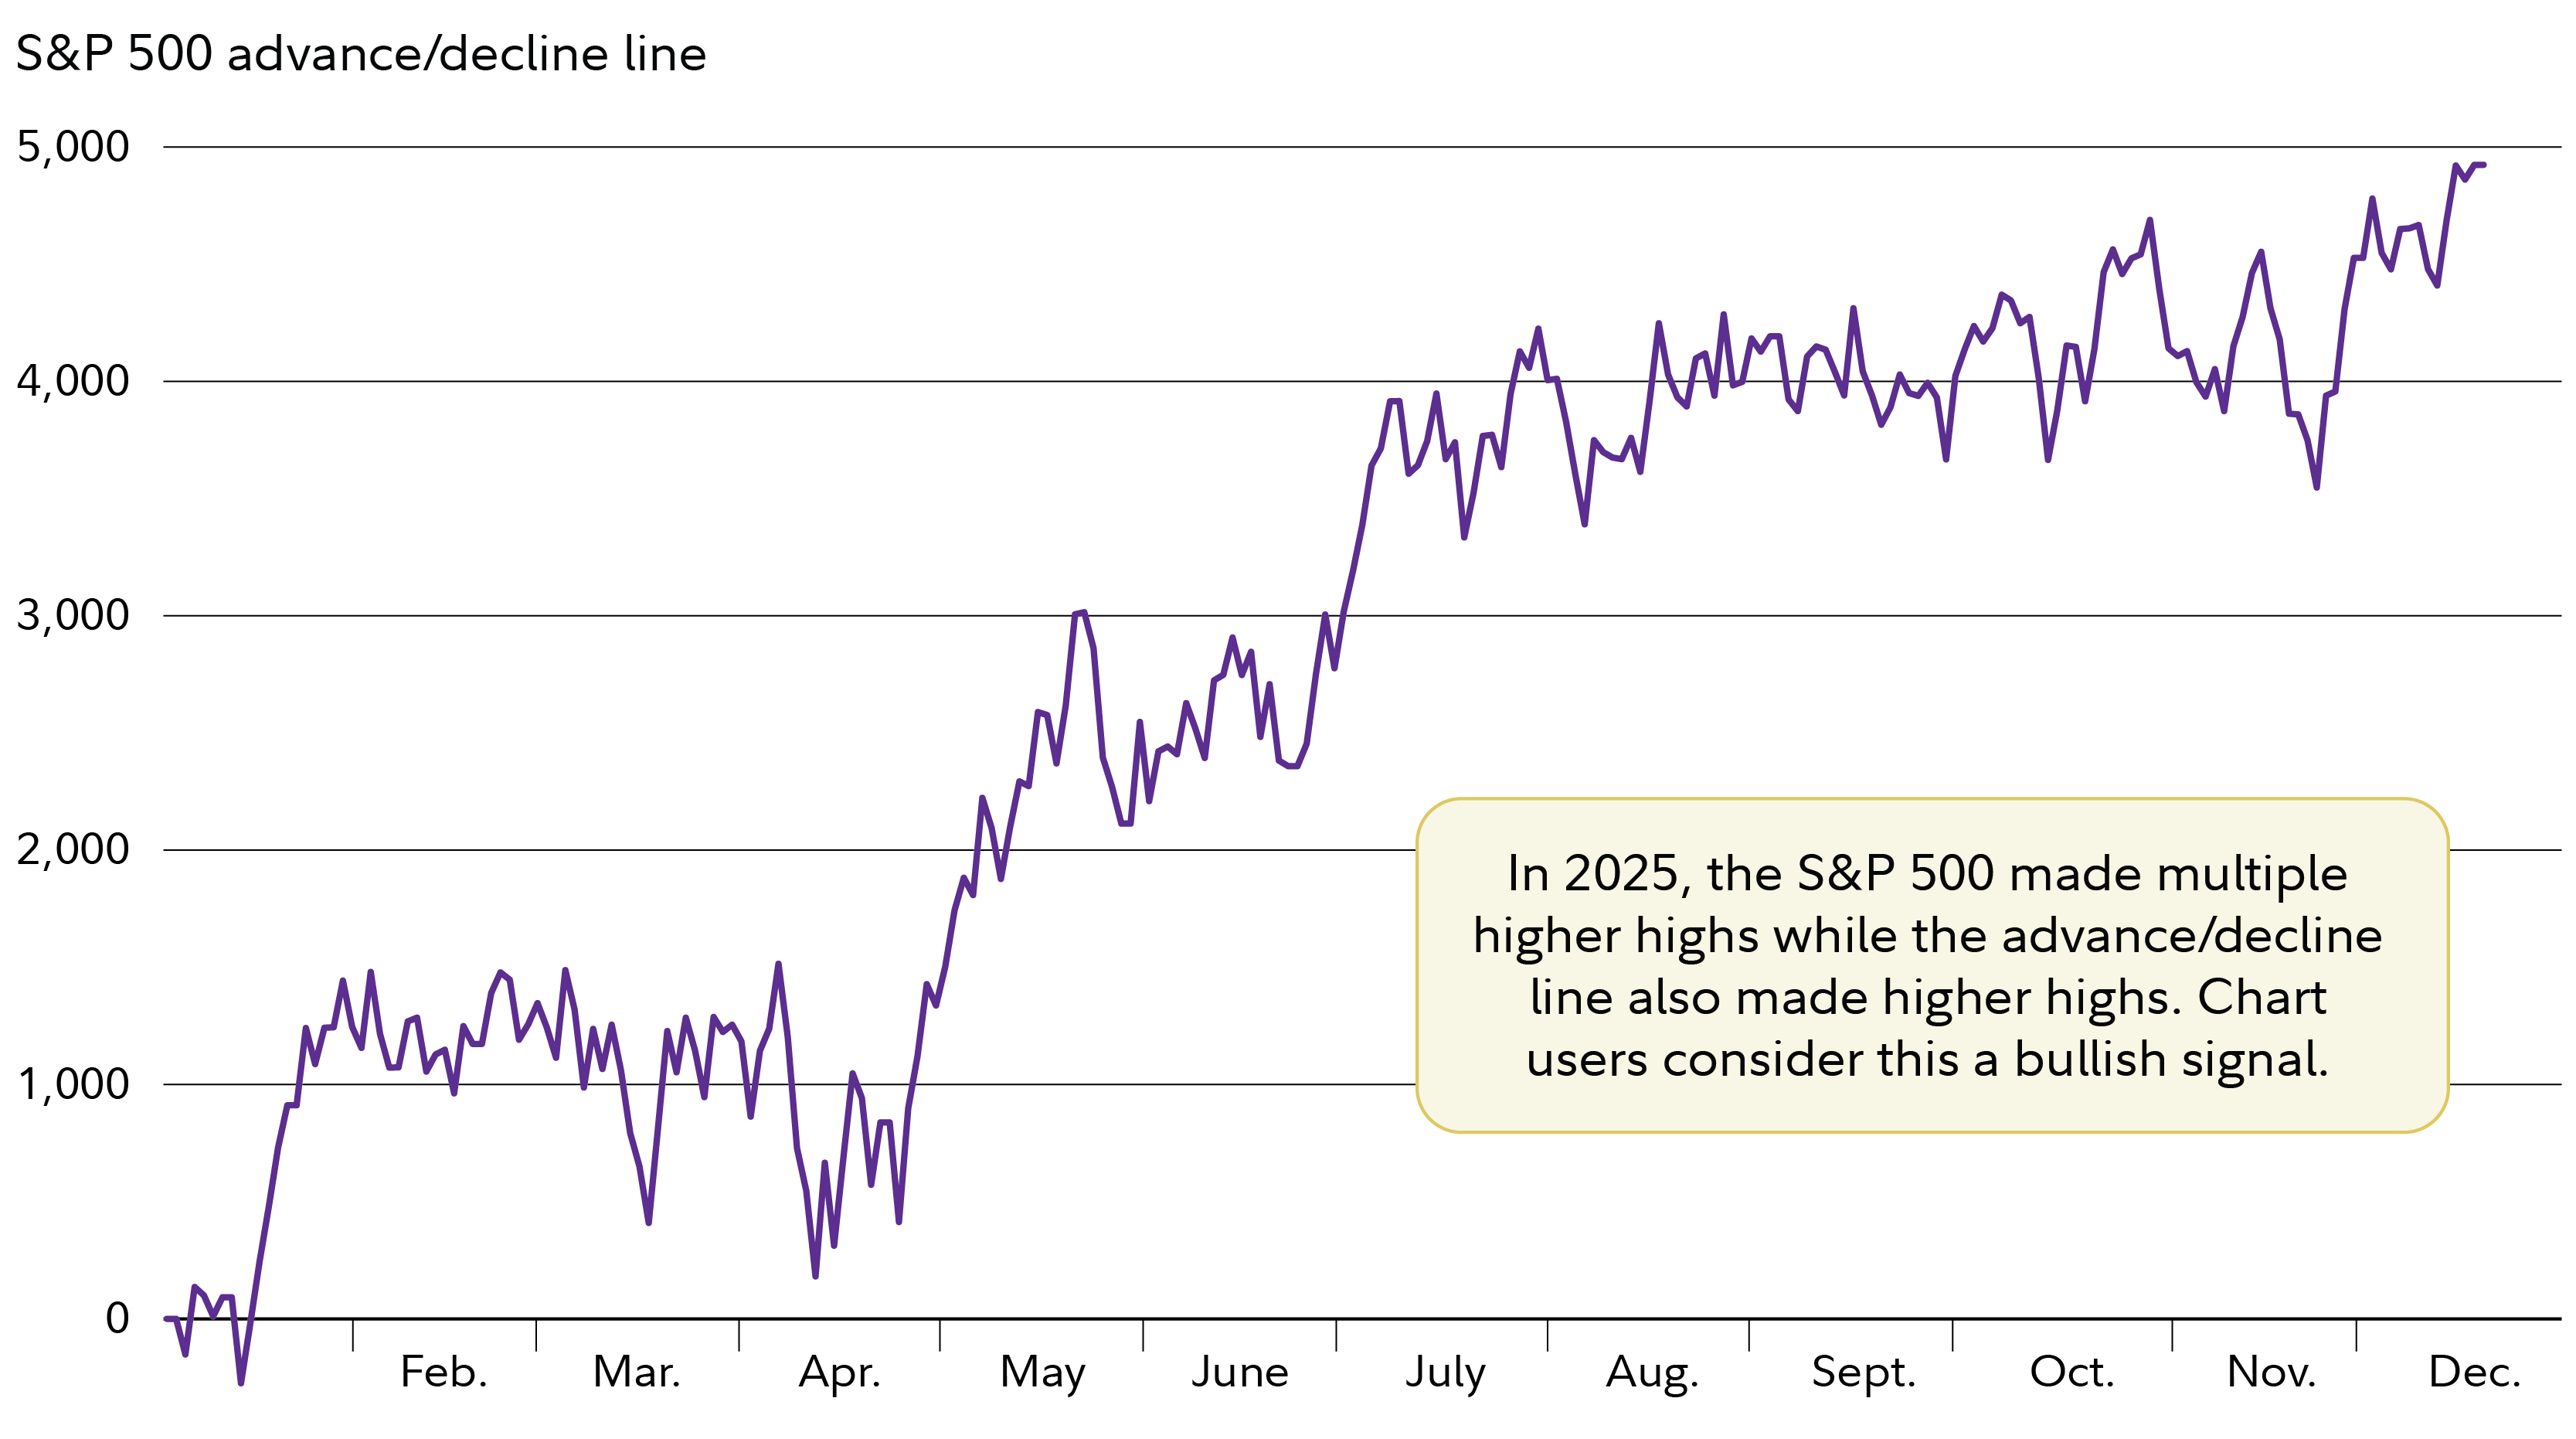
Aided in part by lower oil prices and other factors, market breadth—which attempts to measure the overall health of the stock market by comparing the number of advancing stocks to declining stocks—strengthened thus far in 2025.

Strength across the market runs counter to the notion that certain mega-caps (the Magnificent 7 in particular) have been solely responsible for catapulting the market higher. This perception has led to some concerns that market breadth has become too concentrated in too few stocks, which can be a potential red flag—especially if those leading stocks weaken.
Of course, it is true that stocks like the Mag 7 helped push the market higher in 2025. But stronger market breadth throughout the year suggests the bullish momentum has been more widespread, which is indicative of a healthier market that might withstand some weakness in high-profile stocks.
Another positive signal given by this indicator is that the S&P 500 made multiple higher highs while the advance/decline line also made higher highs. Chart users consider this a bullish signal. A trend to watch going into 2026 is if this market breadth strength persists or begins to reverse.
2026 chart trends
What chart trends will dominate 2026? There’s momentum heading into the new year, but also some growing risks. Investors may want to closely monitor key data points like trends in the labor market, consumer sentiment, and earnings strength, and keep looking for clues in the charts.


