A big question on many working adults' minds is "When can I retire?". For some people, retirement happens for reasons outside their control. Changes at work, family members impacted by illness, personal health challenges, or other circumstances may dictate when they give up their jobs. For those who choose to stop working, the question of when they leave work is important: A few years of working can mean a big difference, both in terms of retirement lifestyle and finances.
The financial planning process can help illustrate what is at stake and identify some of the key questions to ask when considering the timing of your retirement.
To demonstrate, let's look at a hypothetical couple, Bob and Kathy. Bob and Kathy decide to meet with a financial professional from Fidelity to review their options as they begin to discuss when to stop working. Fidelity and other financial companies offer a number of online tools for guidance as well as access to financial professionals. Bob and Kathy have a dedicated Fidelity professional named Dylan as part of their relationship with the company. The couple would like to retire early enough to travel extensively and keep active, but they don't want to risk sacrificing their lifestyle.
When they meet with Dylan, he explains the basic planning process: First they will discuss Bob and Kathy's goals, then review the couple's current situation, and then Dylan will review the potential financial impact of a few different options.
The goals
Bob and Kathy are 60. Bob would like to retire so he can have more time to devote to the activities he loves, like caring for his grandchildren and volunteering with the historical society. Kathy is looking forward to having more time for the community farm where she is a board member. Bob and Kathy love traveling, dining out, and the theater. They feel a bit nervous that they will have to scale back those parts of their lifestyle if they retire too soon.
Bob and Kathy are hoping to retire at 63, but they haven't really looked at what that means for their retirement finances and wonder if it would be worthwhile working a few years longer. Initially, Bob and Kathy wanted a financial plan that would fund retirement until their late 80s, but Dylan suggested planning until 96 due to longevity trends and their own health, so the couple decided to be prepared for a longer retirement.
The checkup
The couple has been saving for a long time and has about $1,000,000 in savings, of which roughly 75% is invested in stocks, 15% in bonds, and 10% in short-term investments. They have another $300,000 of equity in the house they own. Their income while working is $250,000 a year, and at age 67 they will each begin to collect $20,000 annually from Social Security. Their annual expenses are about $80,000 per year, which will grow with inflation over time.
The options
Dylan uses a financial planning tool to illustrate the couple's financial outlook if they retire at 63. The illustrations are based on market simulations. The software runs 1,000 different scenarios for the couple's retirement plan, using hypothetical outcomes based on the historic performance of stocks, bonds, and other investments. The goal is to look at lots of different possible outcomes and create a plan that may work even in challenging market conditions, since it is impossible to predict the actual return of the markets.
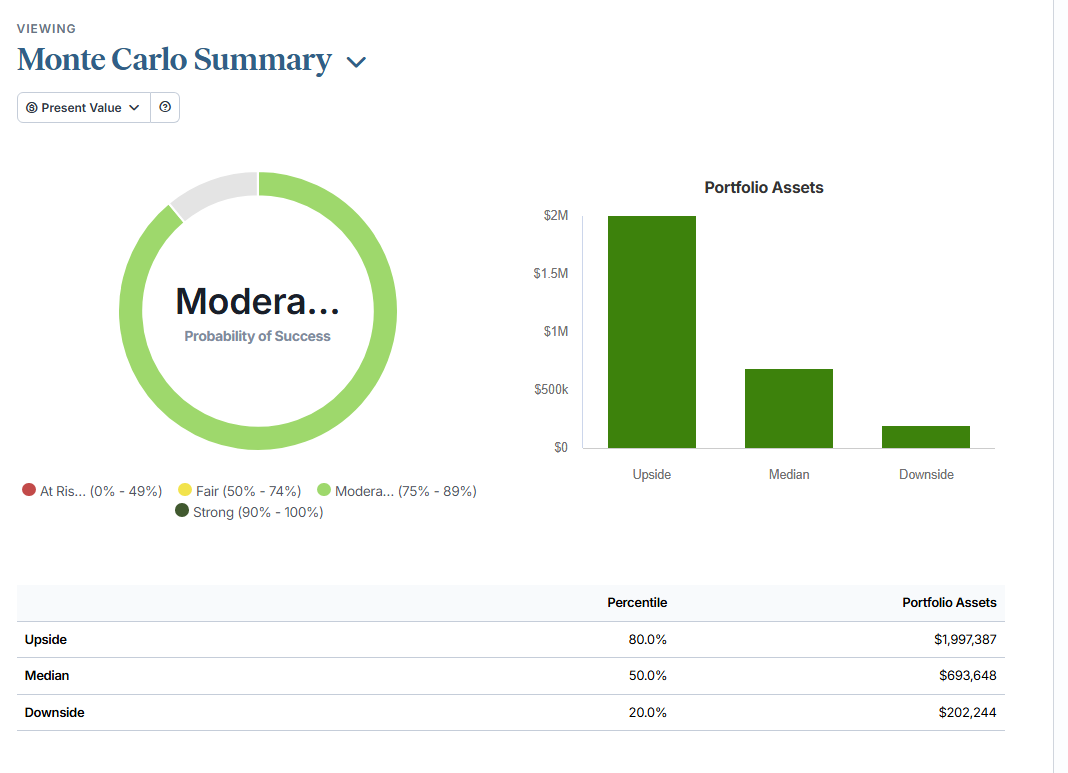
The illustrations suggest that if the couple does retire at 63, they would have a moderate probability of having their plan succeed; in this case that means in about 80% of the scenarios, the couple would be able to meet their expenses, maintain their current lifestyle, and still have some money left in their portfolio at the end of the plan. In an average market, defined in this case as the 50th percentile of the simulations, they could potentially leave a legacy of nearly $700,000 in today's dollars.
On the other hand, some of the scenarios were more challenging. In about 20% of the scenarios, where returns were poor, the couple would only end up with roughly $200,000 left in their portfolio.

Bob and Kathy are worried; they don't want to sacrifice their lifestyle and don't feel comfortable with a plan that came up short in roughly 1 in 5 illustrative scenarios. Dylan runs another illustration, and this time the plan assumes they work 2 years longer, to age 65. In this case, working longer allows the couple to continue making contributions to their savings, delay withdrawals, and give their portfolio more time to potentially grow. They also would delay receiving Social Security, thereby increasing their payout.
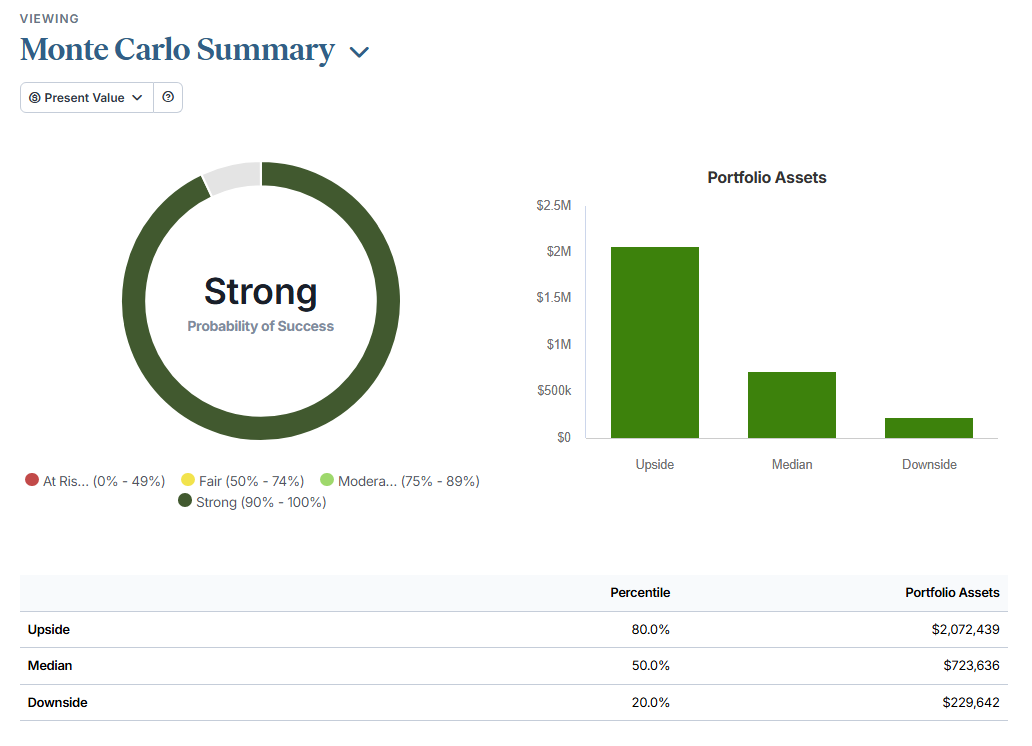
The illustration suggests that working 2 years longer increases the chances of the plan succeeding. According to the illustration, the revised plan would let them maintain their current lifestyle in over 90% of the scenarios, which feels like a strong plan to Kathy and Bob. Even in a challenging market, their portfolio would still leave them with nearly $230,000.

Bob asks if working longer could let them spend more money once they do retire, so Dylan creates one more illustration. Again he models retirement at age 65, but in this scenario he increases the annual spending. The result is that the plan has about the same chance of success as retiring at 63, but the couple can spend an extra $10,000 each year.
Decision time
Bob and Kathy review the numbers with Dylan. They discuss some other options, including part-time work in retirement, different investment approaches, and potential risks to their plan. While Bob and Kathy are eager to start their retirement, they decide that they will be able to enjoy the lifestyle they want with less worry if they wait a little longer. Ultimately confidence in their plan is worth more to them than the increased spending.
Dylan reminds the couple that a lot can change over time, so the 3 decide to meet again each year to update the plan, or more often if there are any big changes in their family or finances.
The bottom line
When can you retire? There is no clear finish line when it comes to saving for retirement, especially during these uncertain times. The financial planning process may be able to help define your goals and illustrate some of the tradeoffs involved. As you make a plan, you can weigh the risks and benefits and make your own decision.


