


As a new options trader, it is not uncommon to feel overwhelmed. One of the benefits of trading options is that it gives you a variety of ways to take advantage of what you believe may happen to the underlying security. But one of the trade-offs for the luxury of this variety is an increased risk for making mistakes. The goal of this article is to create awareness regarding some of the most common options trading mistakes in order to help options traders make more informed decisions.
Mistake #1: Strategy doesn't match your outlook
An important component when beginning to trade options is the ability to develop an outlook for what you believe could happen. Two of the common starting points for developing an outlook are using technical analysis and fundamental analysis, or a combination of both. Technical analysis revolves around interpreting market action (mainly volume and price) on a chart and looking for areas of support, resistance, and/or trends in order to identify potential buy/sell opportunities. Fundamental analysis includes reviewing a company's financial statements, performance data, and current business trends to formulate an outlook on the company's value. An outlook not only consists of a directional bias, but it encompasses a time frame for how long you believe your idea will take to work.
As you review different options strategies, it is important to make sure the strategy you choose is designed to take advantage of the outlook you expect. Fidelity's Options Strategy Guide is one way to familiarize yourself with different strategies, and can help you determine the most appropriate one for your situation.
Mistake #2: Choosing the wrong expiration
As with strategies, you are faced with the issue of having a multitude of choices when deciding on an expiration date. The good news is that if you develop an outlook, then selecting the proper expiration generally falls into place. One way to help you choose the best expiration for your outlook is to have a simple checklist:
- How long do I believe it will take for the trade to play out?
- Do I want to hold the trade through an earnings announcement, stock split, or other events?
- Is there adequate liquidity to support my trade?
Mistake #3: Choosing the wrong position size
Most position sizing errors stem from 2 common emotions: fear or greed. If you are greedy when making decisions, you could end up trading a position size that is too large for your account size. This may occur when a trade goes against the outlook and then you're stuck with a crippling loss. On the other hand, you could be like some traders who trade extremely small. Trading a small size is fine, but you may miss out on a material return.
Common ways of position sizing include:
- Risk a percentage of your account value
- 1%, 2%, 3%, etc.
- Use a consistent dollar value
- $100, $500, $1,000, etc.
Ultimately, when deciding on the trade size, you should be comfortable with the amount of capital you will lose if the trade doesn't go in your favor. Ideally, the trade size should be large enough to be meaningful to the account, but small enough so you don't lose sleep at night.
Mistake #4: Ignoring volatility
Implied volatility is a measure of what the market expects volatility to be in the future for a given security. It is important to recognize if implied volatility is relatively high or low, because it helps determine the price of the option premium. Knowing if the premium is expensive or cheap is an important factor when deciding on what option strategy makes the most sense for your outlook. If the options are relatively cheap, it may be better to look at debit strategies, whereas if the options are relatively expensive, you may be better served looking for credit strategies.
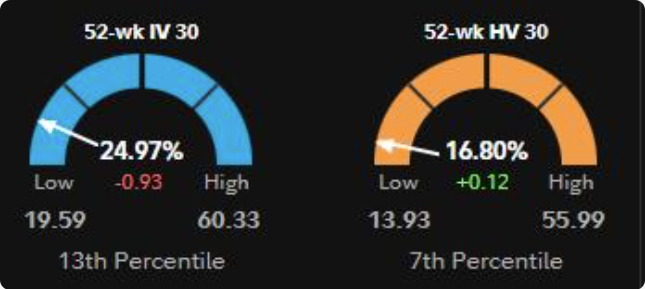
Fidelity Trader+TM Web offers a tool under Option Statistics that you can use to determine if volatility is higher or lower than normal. The same information can also be found on Fidelity's Key Statistics (provided by LIVEVOL, Inc.). In the example below, the 52-week range for 30-day implied volatility on the left was 19.59 to 60.33. This tells you the highest and lowest implied volatility levels for a hypothetical 30-day option over the last 52 weeks, with the current implied volatility level (24.97%) and where it ranks in percentile format. The percentile ranges from 0–100 so a 13% reading implies a relatively low implied volatility environment.
Mistake #5: Not using probability
Taking into account the probabilities for your strategy is an important factor when deciding to place a trade. Not only does it put into perspective what is statistically likely to happen, but it is essential to understanding if your risk/reward makes sense. It is important to note that probability has no directional bias. It is simply the statistical chance of price being at a particular level on the evaluation date, given the current factors. You can use Fidelity's Probability Calculator (provided by Hanweck Associates) to help make this determination.
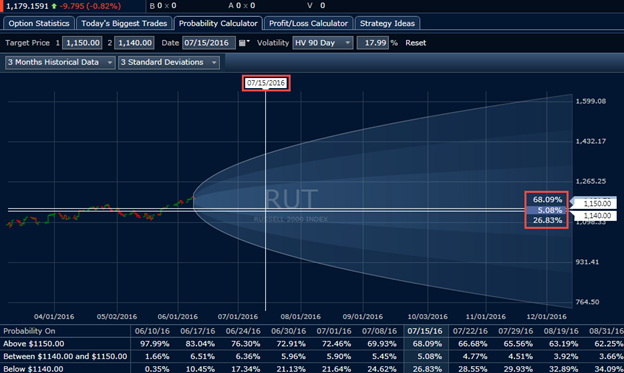
Using the image above, consider this example of an 1140/1150 put credit spread and how probabilities can play into the analysis. The probability of price being above 1150 at expiration is roughly 68% and has approximately a 27% chance of being below 1140. At expiration, any price over 1150 represents maximum gain, and any price below 1140 represents a maximum loss. If you're only able to collect $2.50 for your $10 spread, then just looking at the probabilities alone, you can see if you are being compensated for the risk.
- 68% of the time you will obtain the maximum profit of $250
- $250 x 0.68 = $170
- 27% of the time you will realize the maximum loss of $750
- $750 x 0.27 = -$202.50
If you net the 2 amounts out, there is a net loss of $32.50. This means if you continually put yourself in this scenario, the probabilities dictate over time that you should have negative returns, statistically speaking. Keep in mind 5% of the time, the underlying price in this example will fall between max gain and max loss, and the gain or loss on the position will vary, which will affect the net loss calculation positively or negatively.
Mistake #6: Focusing on the expiration graph
As a trader, it is important to constantly evaluate the amount of risk/reward you have on the table and check to see if it still makes sense for your account. Solely focusing on your positions expiration graph doesn't tell how much risk you carry today, or on a future date.
Using the Profit/Loss Calculator tool (provided by Hanweck Associates) can help you see how your position is going to react to price movement not only today, but any day in the future up until expiration.
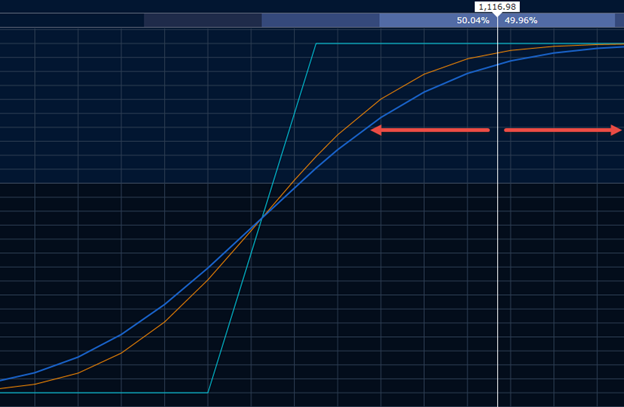
The light blue line represents position at expiration, the dark blue line represents position today, and the orange line is a date selected in the future. In this example, the vertical white line has been moved to the current market price of the underlying, and where it intersects with these lines tells how much profit or loss in the trade.
As the position stands in this example, you've already obtained the majority of profits and have a significant amount of room on the downside to realize maximum loss come expiration if the position moves against you. At this point you may ask yourself, is the potential downside risk worth keeping the position on to realize the maximum gain?
You may consider what would happen if the position makes a large move in either direction over the ensuing days. If it makes a move up, you'd continue to make an additional profit, but it would be a nominal amount in relation to what you've already made. On the other side, with a large downward move you may lose a significant portion of the profits you've already made. At this stage in the trade, the risk/reward has changed and can go unnoticed if you focus only on the expiration day.
Mistake #7: Not having a trading plan
One of the first steps in avoiding common trading mistakes is to have a sound trading plan. A basic trading plan should consist of, but not be limited to:
- How much are you willing to risk per trade?
- How will you find opportunities in the market place?
- When will you enter the trade?
- What is your exit strategy?
As mentioned before, fear and greed can lead to irrational decisions that you wouldn't normally make. The main benefit of having a trading plan is to remove these emotional feelings from your trading. It also creates a process that is easily repeatable. Repeatability is an important factor to help you learn from mistakes and have the ability to see flaws in the trades you place. Without a plan it becomes very difficult to improve as a trader and keep moving forward.
Summary
Trading options involves a number of considerations both before and after the trade has been placed. Many of the mistakes mentioned can be accounted for before the trade is opened by utilizing the tools and resources Fidelity offers. The single most important step to trading options is to develop a plan and stick with it! Some of the tools and resources that can help you establish your own plan include the Options Strategy Guide, Key Statistics, Probability Calculator, and the Profit/Loss Calculator. Take advantage of these and other trading tools and resources Fidelity provides to help you avoid these common options trading mistakes in your future trades.