

If you’ve noticed a lingering “for sale” sign around nearby neighborhoods lately, that could be because of the depreciated condition of many parts of the housing market. From slumping sales that are now in contraction territory (new home sales fell 7% in July compared to the same period a year ago) to historic unaffordability, some real estate investors may be looking for a place to take shelter.
The good news for investors and homebuyers: Some homebuilders have been weathering the storm and mortgage rates have started to come down in recent weeks. Here's a look at the housing market and some ways to navigate the bumpy terrain.
Rates and housing stats
High interest rates and affordability continue to linger over the housing market. While a rate cut may be forthcoming (the CME’s FedWatch tool currently indicates a 100% likelihood of a cut at the September 17 FOMC meeting), rates are likely to remain relatively high for some time. And after the dramatic rise in home prices during the pandemic (and the subsequent surge in mortgage rates), home affordability is near its worst levels ever on record.
Homebuyers have also become more discerning lately, as record numbers of potential buyers are backing out of deals. Real estate company Redfin reported that more than 15% of home purchase agreements fell through in July, which is the highest percentage for that month since the real estate brokerage firm began tracking cancellations in 2017. Redfin also reports that there are currently 36% more home sellers than buyers.
Homebuilders have other factors to deal with as well. US Census Bureau data reveals that, counter to historical trends, new homes are currently priced below existing homes on average. The median price for a new home is roughly $20,000 less than the median price for an existing home.

“Existing home prices have held firm despite the buyer/seller imbalance, while new home prices have been weaker,” says Jordan Michaels, manager of the Fidelity® Select Construction and Housing Portfolio (
Homebuilders adjusting to a shifting landscape
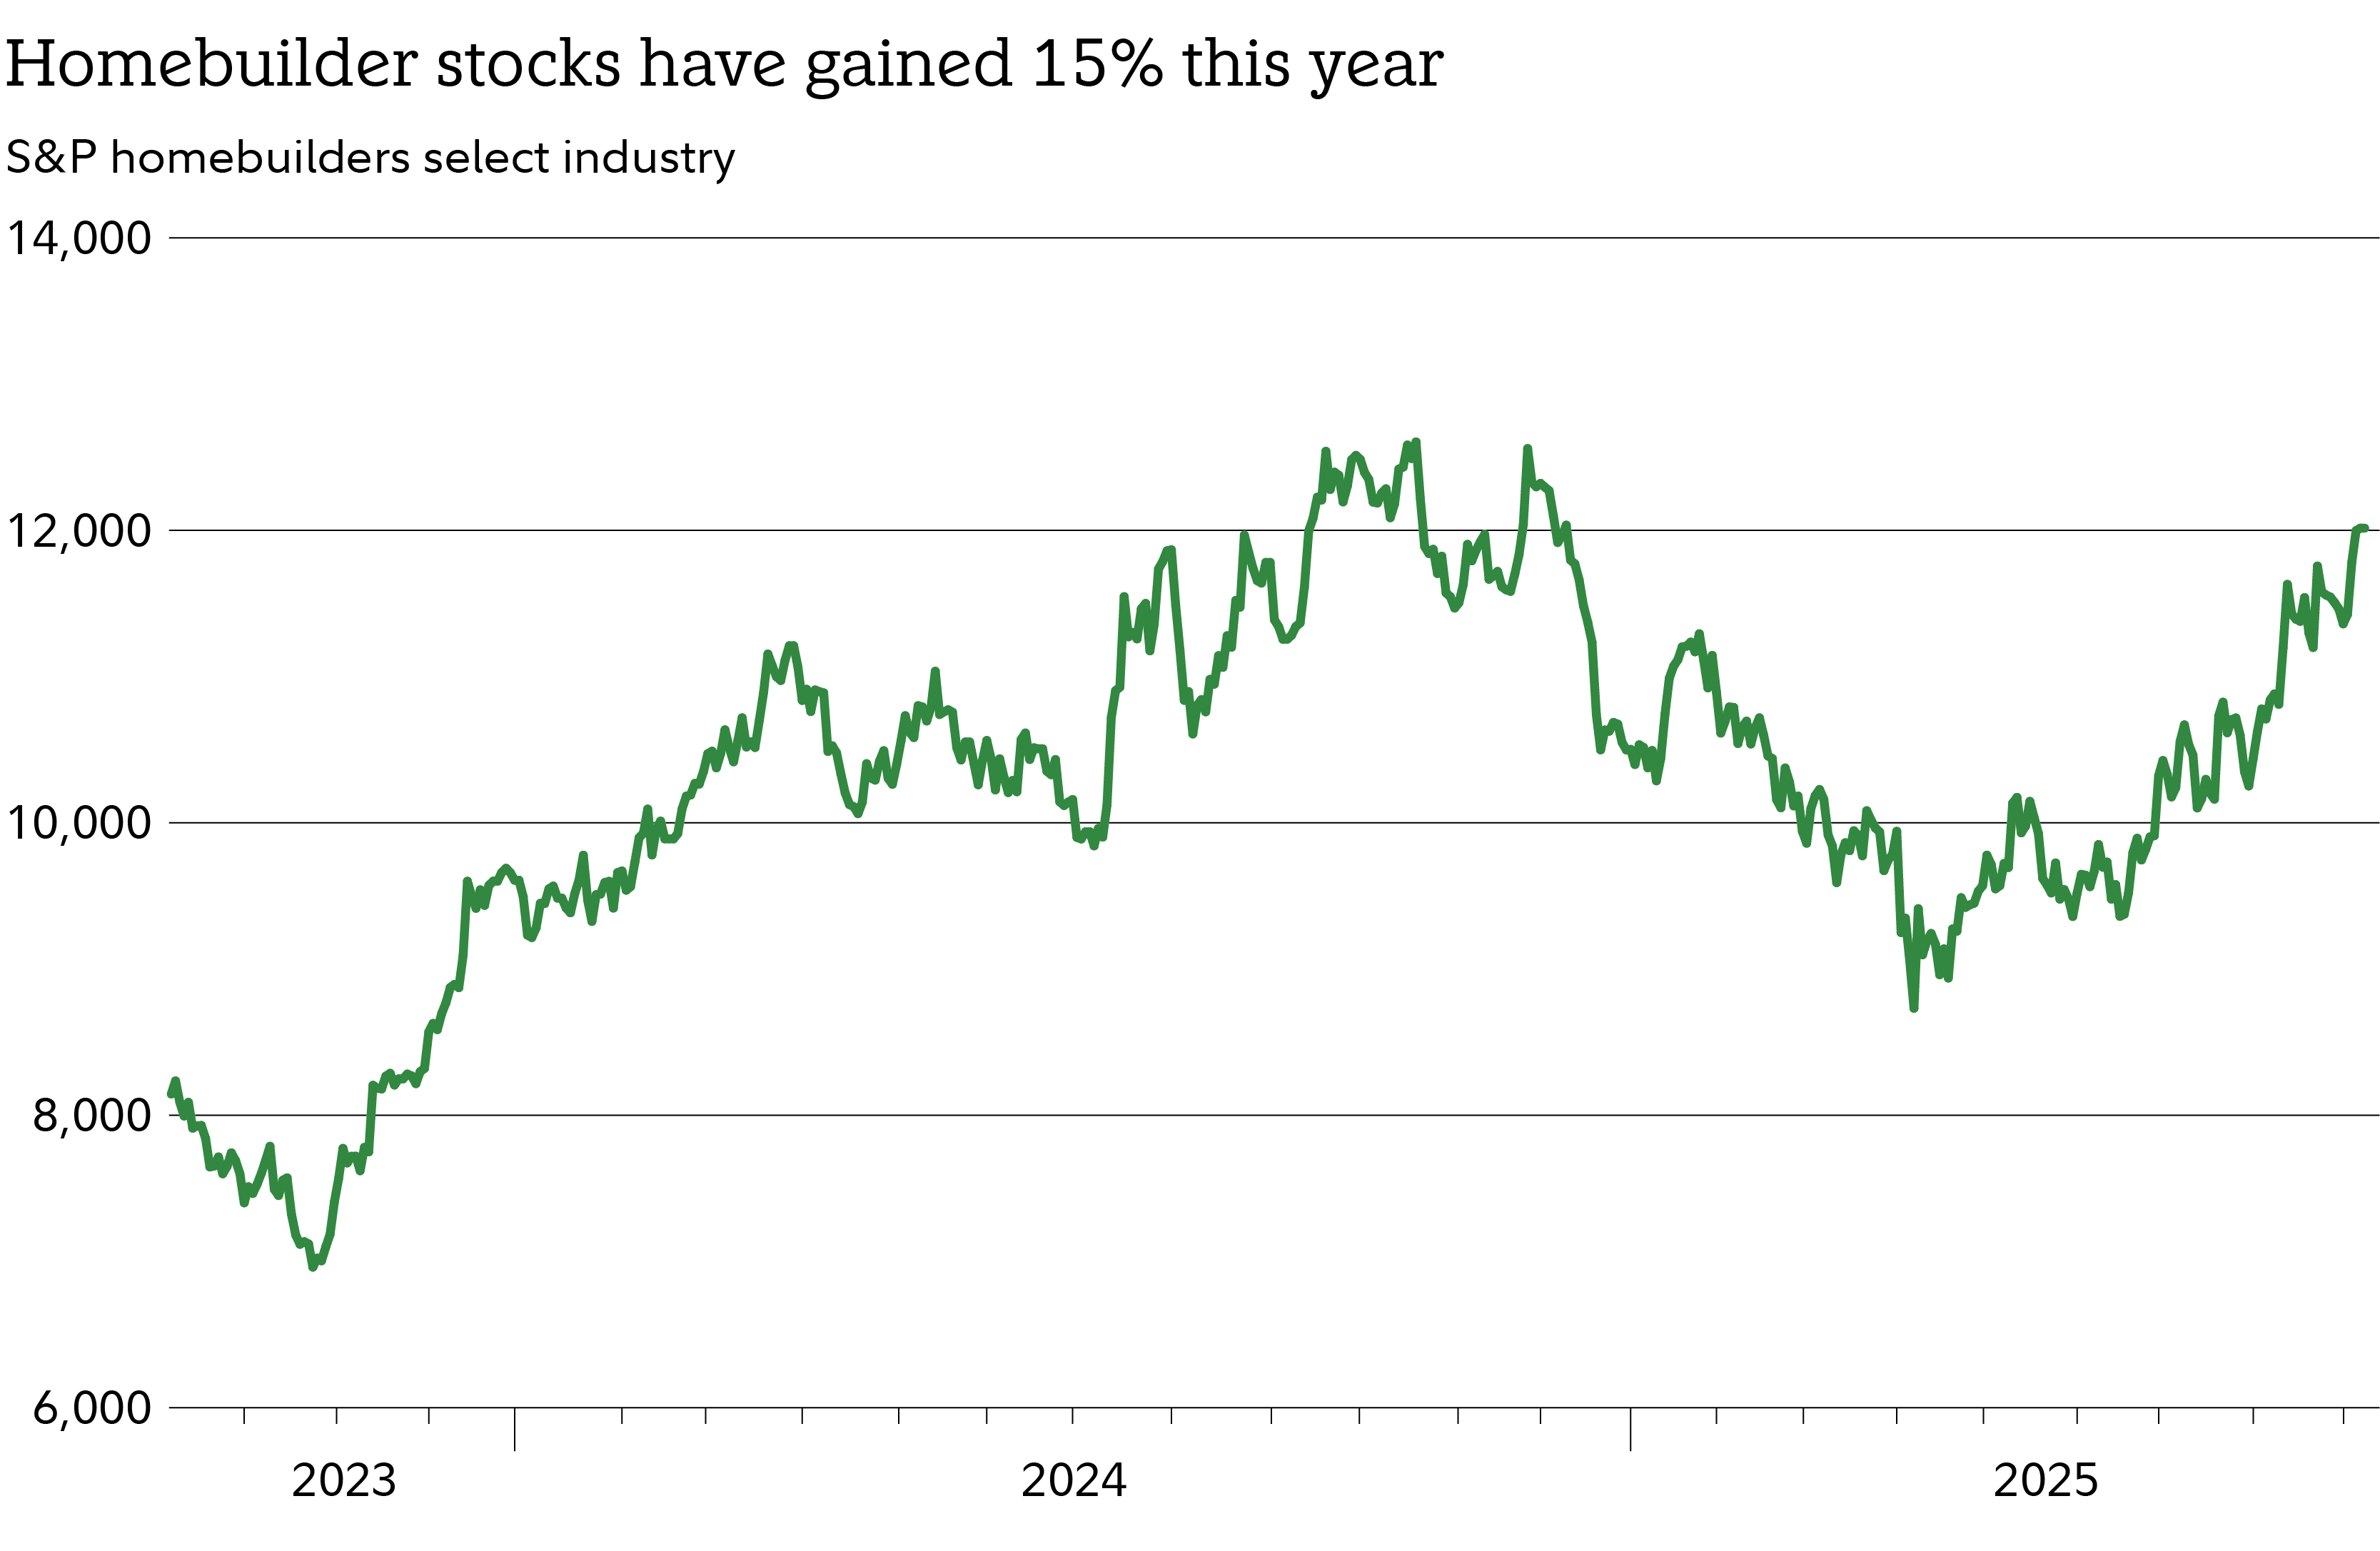
Despite the cracks in real estate’s foundation, the largest US homebuilders have been standing tall. The S&P Homebuilders Select Industry Index has gained 15% this year and is just off its all-time high set last year. Moreover, homebuilders remain cheap compared with the broad market based on a relative forward price-to-earnings ratio basis.
Michaels notes that several big homebuilders have been adapting to adverse market trends in a variety of ways. These include price reductions and other concessions as well as producing smaller homes in many instances with fewer features that can help address affordability challenges to help entice buyers.
"The fund had previously been significantly underweight homebuilders, but over the past year we have opportunistically started to increase allocation to homebuilders, mainly due to their depressed valuations when stock prices had fallen dramatically," Michaels says. "And while the fund has been underweight homebuilders overall, it did still have meaningful overweight positions with select homebuilders including TopBuild (
In addition to select homebuilders, Michaels is finding other ways to play the housing market. “Within the housing segment, I remain more bullish on home improvement retail and furniture makers—2 areas within the housing group where the fund has a significant overweight. These segments are cyclically depressed and, in my view, are poised for an eventual recovery, aided by the potential for lower interest rates in the near term,” Michaels says.
Michaels notes that his top overweight positions in home improvement include Lowe’s (
FSHOX top holdings1
Top-10 holdings of the Fidelity® Select Construction and Housing Portfolio (
- Home Depot (
) – 16.4% - Lowe’s (
) – 12.4% - Trane Technologies – 6.3%
- Johnson Controls – 6.0%
- CRH – 4.1%
- Quanta (
) – 4.1% - Martin Marietta Materials (
) – 4.0% - Sun Communities (
) – 2.8% - PulteGroup (
) – 2.6% - Invitation Homes (
) – 2.5%
(See the most recent fund information.)