Estimate Time5 min

Are we in a recession?

Key takeaways

  • The contraction of Gross Domestic Product in the first quarter by itself does not mean the economy is going into recession.
  • There are headwinds facing both consumers and businesses, but both are coming from a strong position.

A lot of us have recession on the mind lately, especially after this week’s news that Gross Domestic Product (GDP) shrank in the first quarter.

The GDP’s contraction by itself does not mean the economy is going into recession, according to Fidelity's Asset Allocation Research Team, which conducts research into the economy and business cycle. But the outlook for the economy has been clouded by uncertainty about US policies, as well as deteriorating business and consumer expectations.

To get a pulse on where the economy stands now, consider these 13 charts.

Fidelity Viewpoints

Sign up for Fidelity Viewpoints weekly email for our latest insights.


The picture for business

There are headwinds for business as well, especially trade policy uncertainty. But businesses are generally well-positioned to weather a storm.

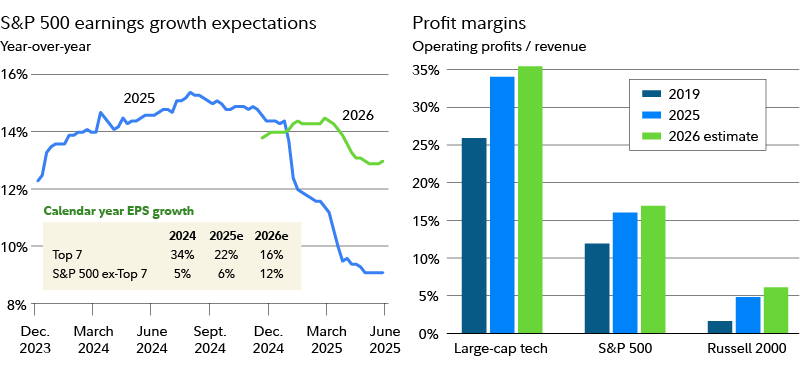
Corporate earnings: Estimates for earnings growth have declined, but corporate earnings are still expected to be up more than 10% this year, and profit margins remain healthy. The largest companies have been the biggest contributors to earnings growth in recent years, and the market expects them to remain strong.

Two charts, one showing that S&P 500 earnings expectations have fallen since the beginning of the year, but are still higher than 2024 expectations were at the same time. The second chart shows profit margins, which are higher now than they were pre-pandemic.
Sources: S&P 500 earnings: Bloomberg Financial LP, Fidelity Investments (AART), as of 3/31/2025. Profit margins: Bloomberg, Fidelity Investments (AART), as of 3/31/2025. The S&P 500 is a market capitalization–weighted index of 500 common stocks chosen for market size, liquidity, and industry group representation to represent US equity performance. The Russell 2000 is a market capitalization–weighted index designed to measure the performance of the small-cap segment of the US equity market. It includes approximately 2,000 of the smallest securities in the Russell 3000 Index.

Manufacturing bullwhip: Trade policy uncertainty weighed on the US manufacturing sector. It can take time for this pressure to percolate into business results, but one early warning signal is the US bullwhip—defined as new orders minus inventories. When this is high, it can signal manufacturing will be ramping up, because new demand cannot be met by existing inventories. When it is low, it can signal little need for new manufacturing, because recent orders can easily be met by existing inventory. In the most recent reading, the US bullwhip had taken a sudden plunge.

Graphic shows new orders less inventories for US, emerging, and developed markets. The US has dropped steeply, a marked contrast to emerging and developing markets.
Source: New orders and inventories are sourced from purchasing manager indices (PMIs). DM: Developed markets. EM: Emerging markets. Source: Markit, Institute for Supply Management, S&P Global, Macrobond, Fidelity Investments (AART) as of 3/31/25.

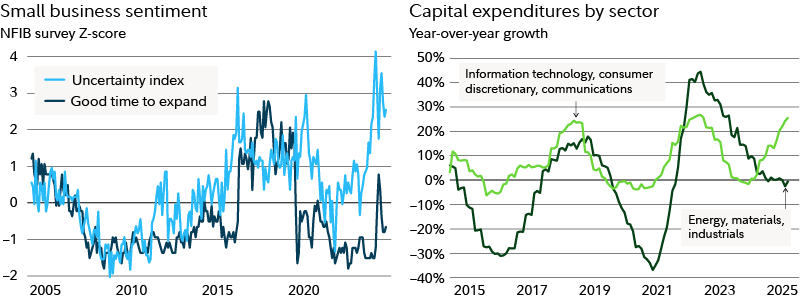
Small-business uncertainty: Sentiment surveys show small businesses expressing near record-high levels of uncertainty amid the flurry of tariff and other policy announcements. It’s too soon to tell if this uncertainty will endure long enough to cause businesses to reduce their spending over time.

Graphic shows the level of uncertainty for small businesses, which has spiked since late 2024 and is now the highest it has been over the span of the chart.
Source: National Federation of Independent Business, NBER, Macrobond, Fidelity Investments (AART), as of 2/28/2025. The NFIB Uncertainty Index measures the sentiment of small-business owners in the United States and is based on the percentage of respondents who indicate they are "uncertain" or "don't know" in response to 6 specific survey questions. It reflects the level of uncertainty among small-business owners about their future prospects.

How consumers are doing

Consumers are the linchpin of the US economy, and they’ve held up remarkably well against the headwinds of inflation over the past few years.

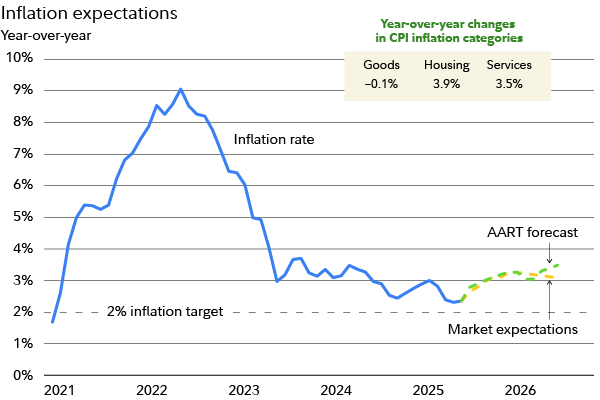
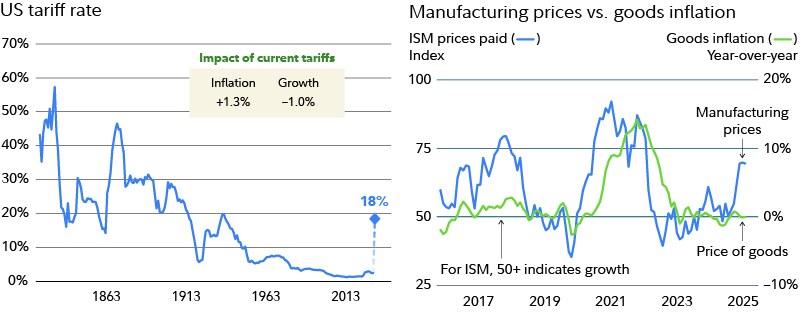
Inflation: While inflation unexpectedly cooled in March, this is largely seen as a temporary reprieve, as tariffs threaten to fuel future price increases.

Two charts, one showing that inflation for goods has fallen below the rate for rents and services, but goods prices have picked up recently. The second shows manufacturing costs rising, which can lead to higher consumer prices.
Sources: Components of CPI: Federal Reserve Bank of New York, Macrobond, Fidelity Investments (AART), as of 2/28/2025. Manufacturing prices: Federal Reserve, Federal Reserve Bank of New York, Macrobond, Fidelity Investments (AART), as of 3/31/2025. The ISM Manufacturing Prices Paid Index measures changes in prices paid by manufacturing firms for their inputs, including raw materials and other goods and services. A reading above 50 indicates that prices are generally increasing, while a reading below 50 suggests they are decreasing.

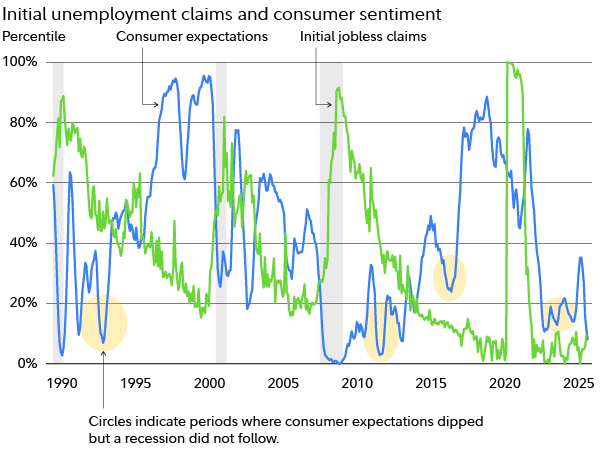
Consumer sentiment: Confidence among consumers has shown a steep decline over the past 4 months. But drops in consumer sentiment have historically not accurately forecasted a slowdown in consumer spending—unless labor-market conditions also begin to deteriorate. (More on the job market below.)

Graphic shows consumer sentiment since 2000. Sentiment is below pre-pandemic levels and has fallen in recent months.
Source: University of Michigan, retrieved from FRED, Federal Reserve Bank of St. Louis, April 25, 2025.

Consumers' expectation for inflation, another important indicator, has surged in recent months. These expectations are important because they can sometimes be self-fulfilling. Consumers may be more willing to accept price increases, and workers may demand higher wages to offset inflation, both of which can drive businesses to raise prices.

Chart shows consumer 5-year inflation expectations since 2005. Expectations have spiked in recent months.
Consumer inflation expectations are a 3-month moving average of the University of Michigan Consumer Survey of 5-year inflation expectations. Sources: Federal Reserve Bank of New York, Federal Reserve Bank of Cleveland, Federal Reserve Bank of Philadelphia, University of Michigan, Macrobond, Fidelity Investments (AART), as of 3/31/2025.

Consumer spending: As pessimistic as consumers have been in recent months, they have continued to spend money. Spending growth is still above the pre-pandemic average, buoyed by wage growth, which has outstripped inflation for the past 2 years.

Two charts, one showing consumer spending continues to grow at a rate higher than the pre-pandemic average. The second shows that wages have been rising faster than the rate of inflation since late 2022.
Sources: Consumer spending: Model uses wage growth, consumer income expectations, change in initial unemployment claims, net worth growth, and credit growth. Source: Federal Reserve Bank of Atlanta, Conference Board, Federal Reserve, US Department of Labor, Macrobond, Fidelity Investments (AART) as of 3/31/2025. Wage growth: US Bureau of Labor Statistics, median weekly real earnings of full-time wage and salary workers, age 16 and over, retrieved from FRED, Federal Reserve Bank of St. Louis, April 4, 2025.

Job market: So far, the job market has remained strong, despite rising policy uncertainty, rising business uncertainty, and government layoffs. Job openings have fallen slightly but remain above pre-pandemic levels.

Chart shows the number of job openings since 2006. The number spiked after the pandemic and has been dropping since, but it has settled above pre-pandemic levels.
Source: Bureau of Labor Statistics JOLTS Survey, National Federation of Independent Business, Macrobond, Fidelity Investments (AART), as of 2/28/25.

The markets

Stocks: Stocks are considered an important “leading indicator,” meaning they tend to turn before the economy does. For example, bear markets in the US stock market tend to bottom out several months, or even quarters, before the US economy hits a bottom. That said, they’re an imperfect and noisy indicator, and not every market dip is followed by a recession.

Graphic shows the S&P 500 closing price for the past year.
Source: Fidelity Investments, as of April 25, 2025.

Credit spreads: The bond market is often considered a better signal to follow. One key indicator investors have been watching recently is credit spreads, which are the additional yield bonds with default risk (such as investment-grade corporate bonds or high-yield corporate bonds) pay over US Treasurys. While credit spreads have been rising recently, they have remained well below peak levels from the past 10 years—indicating the level of risk, though higher, may still be relatively low in historical terms.

Chart shows the spread between high-yield bonds and US Treasurys. An increasing yield premium often signals a negative turn in the economy. While spreads have spiked, they are still far below the levels they reached in 2016, 2020, and 2022.
Source: Ice Data Indices, LLC, ICE BofA US High Yield Index Option-Adjusted Spread, retrieved from FRED, Federal Reserve Bank of St. Louis; April 11, 2025. See footnote 1 for more information. The data represents spreads between a computed index of all bonds in a given rating category and a spot Treasury curve.

The bottom line

So far, the signals above are not flashing recession. But if you feel the need to prepare for the worst, you may want to consider these 6 ways to recession-proof your life, moves that can make sense in good times and bad.

Having a financial plan in place that accounts for all possibilities can be reassuring. To get your plan started, or to strengthen the plan you already have, consider working with a financial professional.

Put your investing ideas to work

Get industry-leading research, guidance, tools, and pricing.

More to explore

1. The ICE BofA Option-Adjusted Spreads (OASs) are the calculated spreads between a computed OAS index of all bonds in a given rating category and a spot Treasury curve. An OAS index is constructed using each constituent bond's OAS, weighted by market capitalization. The ICE BofA High Yield Master II OAS uses an index of bonds that are below investment grade (those rated BB or below). This data represents the ICE BofA US High Yield Index value, which tracks the performance of US dollar denominated below investment grade rated corporate debt publicly issued in the US domestic market. To qualify for inclusion in the index, securities must have a below investment grade rating (based on an average of Moody's, S&P, and Fitch) and an investment grade rated country of risk (based on an average of Moody's, S&P, and Fitch foreign currency long term sovereign debt ratings). Each security must have greater than 1 year of remaining maturity, a fixed coupon schedule, and a minimum amount outstanding of $100 million. Original issue zero coupon bonds, "global" securities (debt issued simultaneously in the eurobond and US domestic bond markets), 144a securities and pay-in-kind securities, including toggle notes, qualify for inclusion in the Index. Callable perpetual securities qualify provided they are at least one year from the first call date. Fixed-to-floating rate securities also qualify provided they are callable within the fixed rate period and are at least one year from the last call prior to the date the bond transitions from a fixed to a floating rate security. DRD-eligible and defaulted securities are excluded from the Index.

Past performance is no guarantee of future results.

Investing involves risk, including risk of loss.

Views expressed are as of the date indicated, based on the information available at that time, and may change based on market or other conditions. Unless otherwise noted, the opinions provided are those of the speaker or author and not necessarily those of Fidelity Investments or its affiliates. Fidelity does not assume any duty to update any of the information.

Stock markets are volatile and can fluctuate significantly in response to company, industry, political, regulatory, market, or economic developments. Investing in stock involves risks, including the loss of principal.

The S&P 500® Index is a market capitalization-weighted index of 500 common stocks chosen for market size, liquidity, and industry group representation to represent US equity performance.

Indexes are unmanaged. It is not possible to invest directly in an index.

Fidelity Brokerage Services LLC, Member NYSE, SIPC, 900 Salem Street, Smithfield, RI 02917

1201457.1.1