Estimate Time4 min

ETF flows buck volatility

Key takeaways

  • ETF flows broadly slowed in Q1 compared to the prior quarter but remained relatively strong.
  • Tech, financial sector-based ETF flows led.
  • Active ETF flows have continued to gain momentum.

Coming off the all-time yearly record, US-based ETF flows slowed during tariff-induced Q1 market volatility. Yet they still managed to gather hundreds of billions in assets to join a strong current of flows.

Here were the biggest trends in ETF flows to start the year.

Stock flows lead despite volatility, fixed income surged

It was going to be a tall ask to match the gargantuan equity (e.g., stock) ETF flows from the last quarter of last year. And the market backdrop was not particularly conducive, with the S&P 500 falling from all-time highs by mid-February through quarter-end.

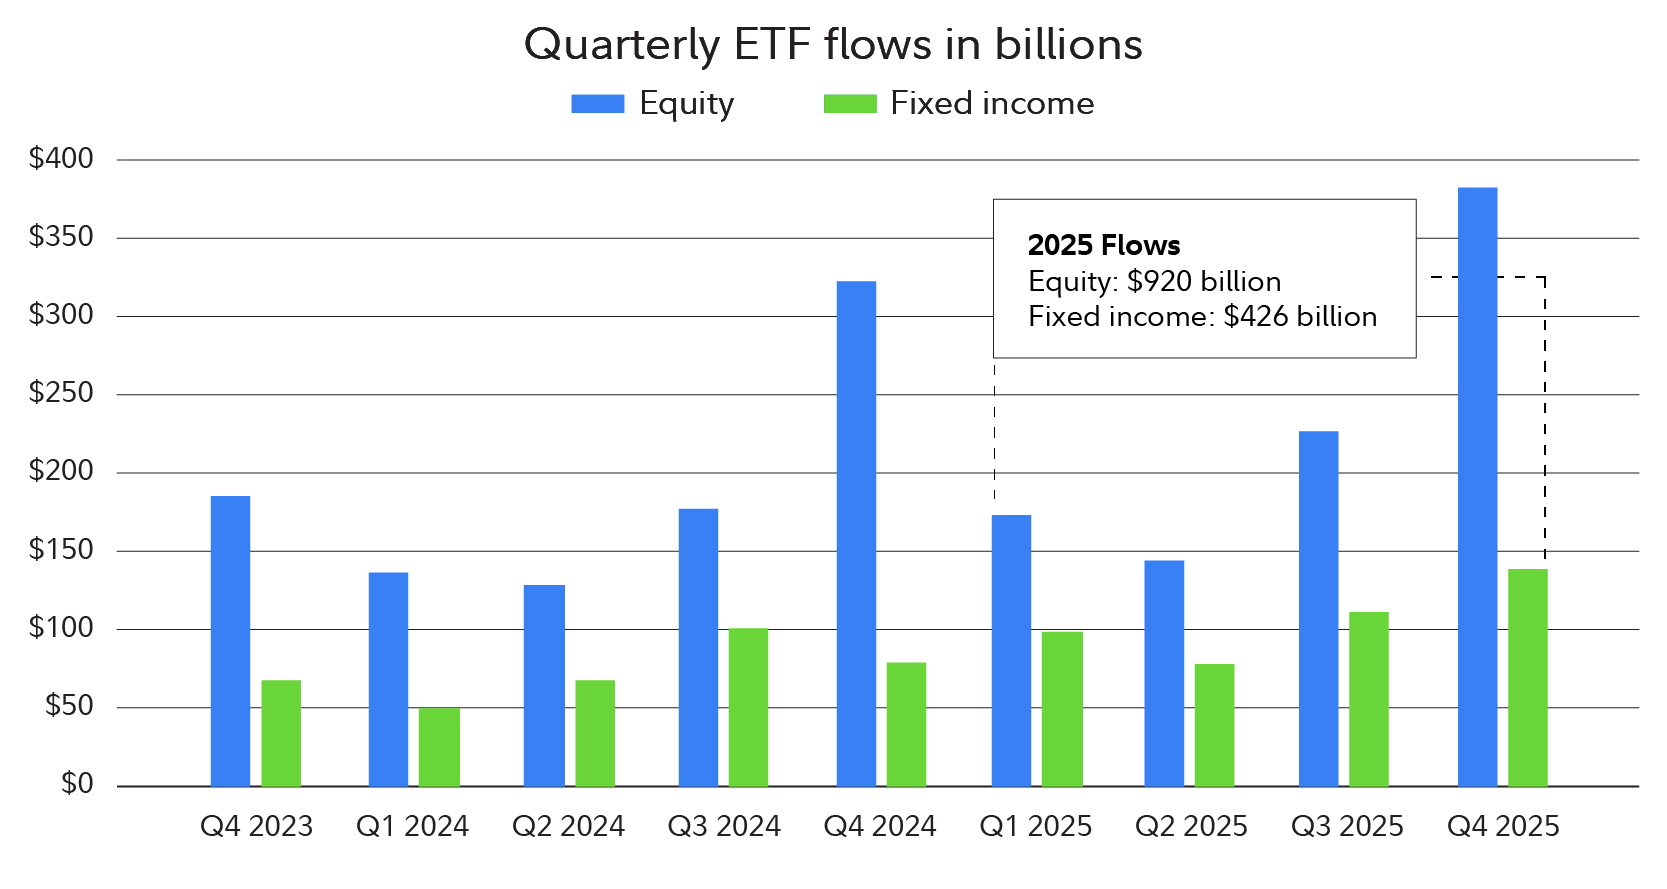
After accumulating a quarterly record of $312 billion equity ETF flows in Q4, they slowed sequentially to just over half that amount in Q1 2025. Despite the quarter-over-quarter slowdown, that’s still a relatively robust haul that topped flows for the same category in Q1 2024. It’s even more remarkable to have happened amid huge stock market price swings.

The chart is described in the text above the chart.
Source: Fidelity Investments, as of May 11, 2025.

While equity ETF flows slowed from the prior quarter, fixed income (e.g., bond) ETF flows ramped up. The over $100 billion in fixed income ETF flows during Q1 roughly matched the best quarter from last year (Q3), and easily outpaced both Q4 2024 as well as Q1 2024. The Q1 fixed income cume builds on momentum from last year, when this category accumulated $301 billion in flows during 2024. With that said, equity ETF flows have now outpaced fixed income ETF flows for 8 consecutive quarters.

Tech, financial ETF flows beat back market vol

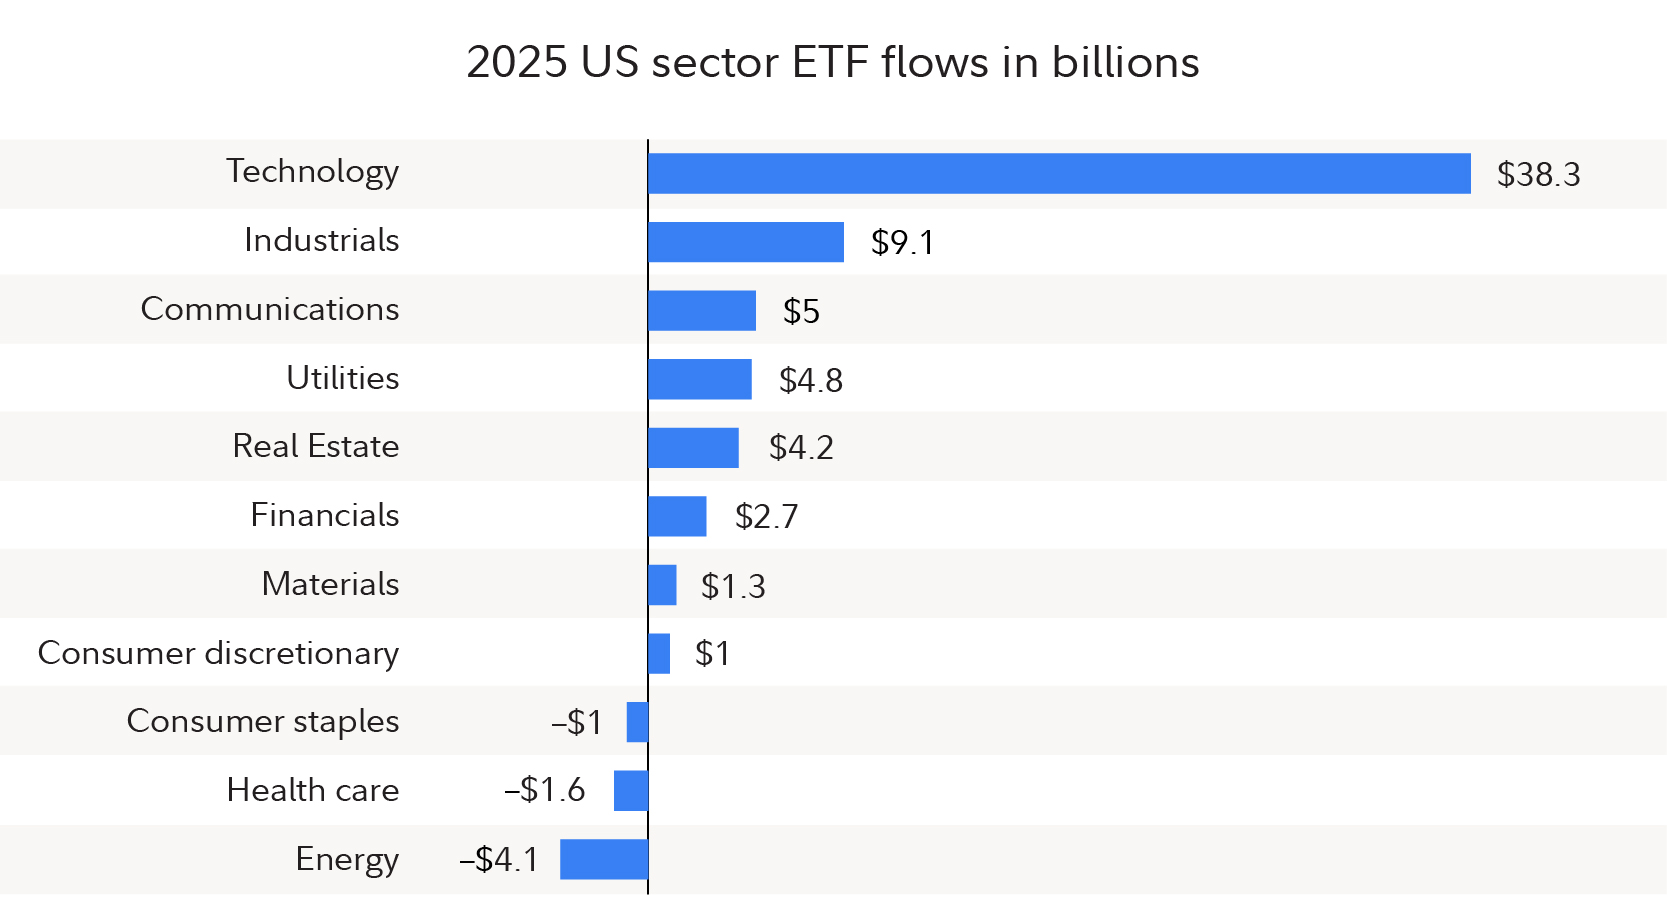
Somewhat surprisingly, the 2 sectors that attracted the most sector-based ETF flows in Q1 were technology and financials (both sectors underperformed the broad market during the quarter with market volatility having hit cyclical sectors harder than defensive sectors). Momentum may have played a role, as tech and financials attracted the most net flows during Q4 2024.

The chart is described in the text above the chart.
Source: Fidelity Investments, as of May 11, 2025.

Meanwhile, commodity-linked sectors saw steep outflows, even though many key commodity prices didn’t start experiencing steeper price declines until early Q2. Oil prices, for example, fell marginally from $73 per barrel at the start of the year to $71 by the end of Q1 (it's worth noting that they have since fallen further). At the same time, gold prices surged during Q1. Those sector outflows may have reflected future economic concerns and the impact that recession risks could have on the demand for raw materials.

Active ETFs sustained momentum

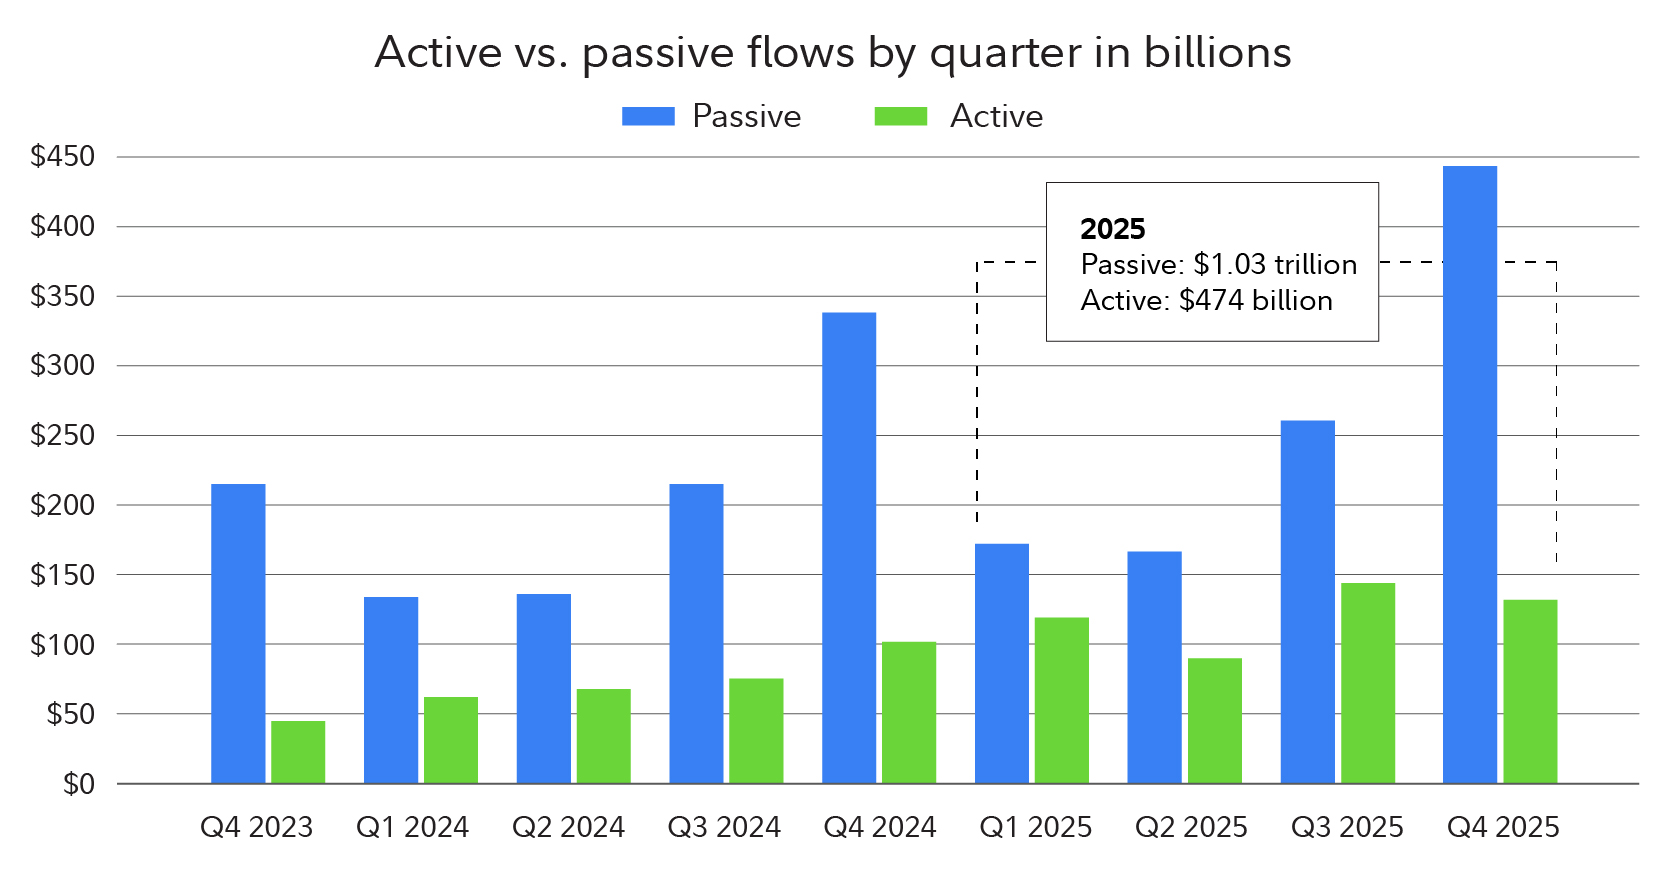
The emergence of active ETFs was one of the trends that solidified throughout 2024. Actively managed ETFs, which in contrast to passively managed ETFs are not designed to track a benchmark, accounted for $299 billion of ETF industry inflows in 2024. Of the 723 ETFs that were launched in 2024 (a new annual record), 575 were actively managed ETFs.

The multiyear trend of active ETF asset growth continued in Q1, with this group gathering $116 billion in flows. Moreover, the quarterly gap between actively managed ETF flows and passively managed ETF flows notably narrowed.

The chart is described in the text above the chart.
Source: Fidelity Investments, as of May 11, 2025.

Thus far in Q2, this trend appears to have gained steam. And many ETF industry watchers expect that 2025 could be another record setter for active ETF flows and new issuances.

Looking for ETFs?

ETF flows can be a useful tool to help identify market trends, and to see where investors are broadly putting their money. If you are interested in investing in ETFs, Fidelity's ETF ScreenerLog In Required can quickly sort through a lot of data based on the filtering selections you make.

You can search for ETFs using a variety of characteristics, like the fund's objectives, fundamentals, technicals, performance, volatility, trading characteristics, tax considerations, and analyst ratings.

Find the right ETF for you

Use our screener to identify ETFs and ETPs that match your investment goals.

More to explore

Get started trading

Get industry-leading research, guidance, tools, and pricing. Open an account.

Past performance is no guarantee of future results.

Exchange-traded products (ETPs) are subject to market volatility and the risks of their underlying securities, which may include the risks associated with investing in smaller companies, foreign securities, commodities, and fixed income investments. Foreign securities are subject to interest rate, currency exchange rate, economic, and political risks, all of which are magnified in emerging markets. ETPs that target a small universe of securities, such as a specific region or market sector, are generally subject to greater market volatility, as well as to the specific risks associated with that sector, region, or other focus. ETPs that use derivatives, leverage, or complex investment strategies are subject to additional risks. The return of an index ETP is usually different from that of the index it tracks because of fees, expenses, and tracking error. An ETP may trade at a premium or discount to its net asset value (NAV) (or indicative value in the case of exchange-traded notes). The degree of liquidity can vary significantly from one ETP to another and losses may be magnified if no liquid market exists for the ETP's shares when attempting to sell them. Each ETP has a unique risk profile, detailed in its prospectus, offering circular, or similar material, which should be considered carefully when making investment decisions.

The Fidelity ETF Screener is a research tool provided to help self-directed investors evaluate these types of securities. The criteria and inputs entered are at the sole discretion of the user, and all screens or strategies with preselected criteria (including expert ones) are solely for the convenience of the user. Expert Screeners are provided by independent companies not affiliated with Fidelity. Information supplied or obtained from these Screeners is for informational purposes only and should not be considered investment advice or guidance, an offer of or a solicitation of an offer to buy or sell securities, or a recommendation or endorsement by Fidelity of any security or investment strategy. Fidelity does not endorse or adopt any particular investment strategy or approach to screening or evaluating stocks, preferred securities, exchange-traded products, or closed-end funds. Fidelity makes no guarantees that information supplied is accurate, complete, or timely, and does not provide any warranties regarding results obtained from its use. Determine which securities are right for you based on your investment objectives, risk tolerance, financial situation, and other individual factors, and reevaluate them on a periodic basis. ETFs are subject to market fluctuation and the risks of their underlying investments. ETFs are subject to management fees and other expenses. All the data presented within are from Fidelity Investments and Bloomberg, as of May 14, 2025. These data do not reflect mutual fund data, and investors who would like to monitor the entire fund flow universe may want to consider flows going into or out of mutual funds.

Fidelity Brokerage Services LLC, Member NYSE, SIPC, 900 Salem Street, Smithfield, RI 02917

1205330.1.0