If you’re dreaming of a retirement spent sipping sweet tea on a sunny front porch instead of shoveling snow from an icy sidewalk, you have plenty of company.
About 300,000 people of retirement age move to the Sun Belt every year, according to a 2022 Census Bureau report. More than one-third of them move to Florida, with Arizona a distant second.
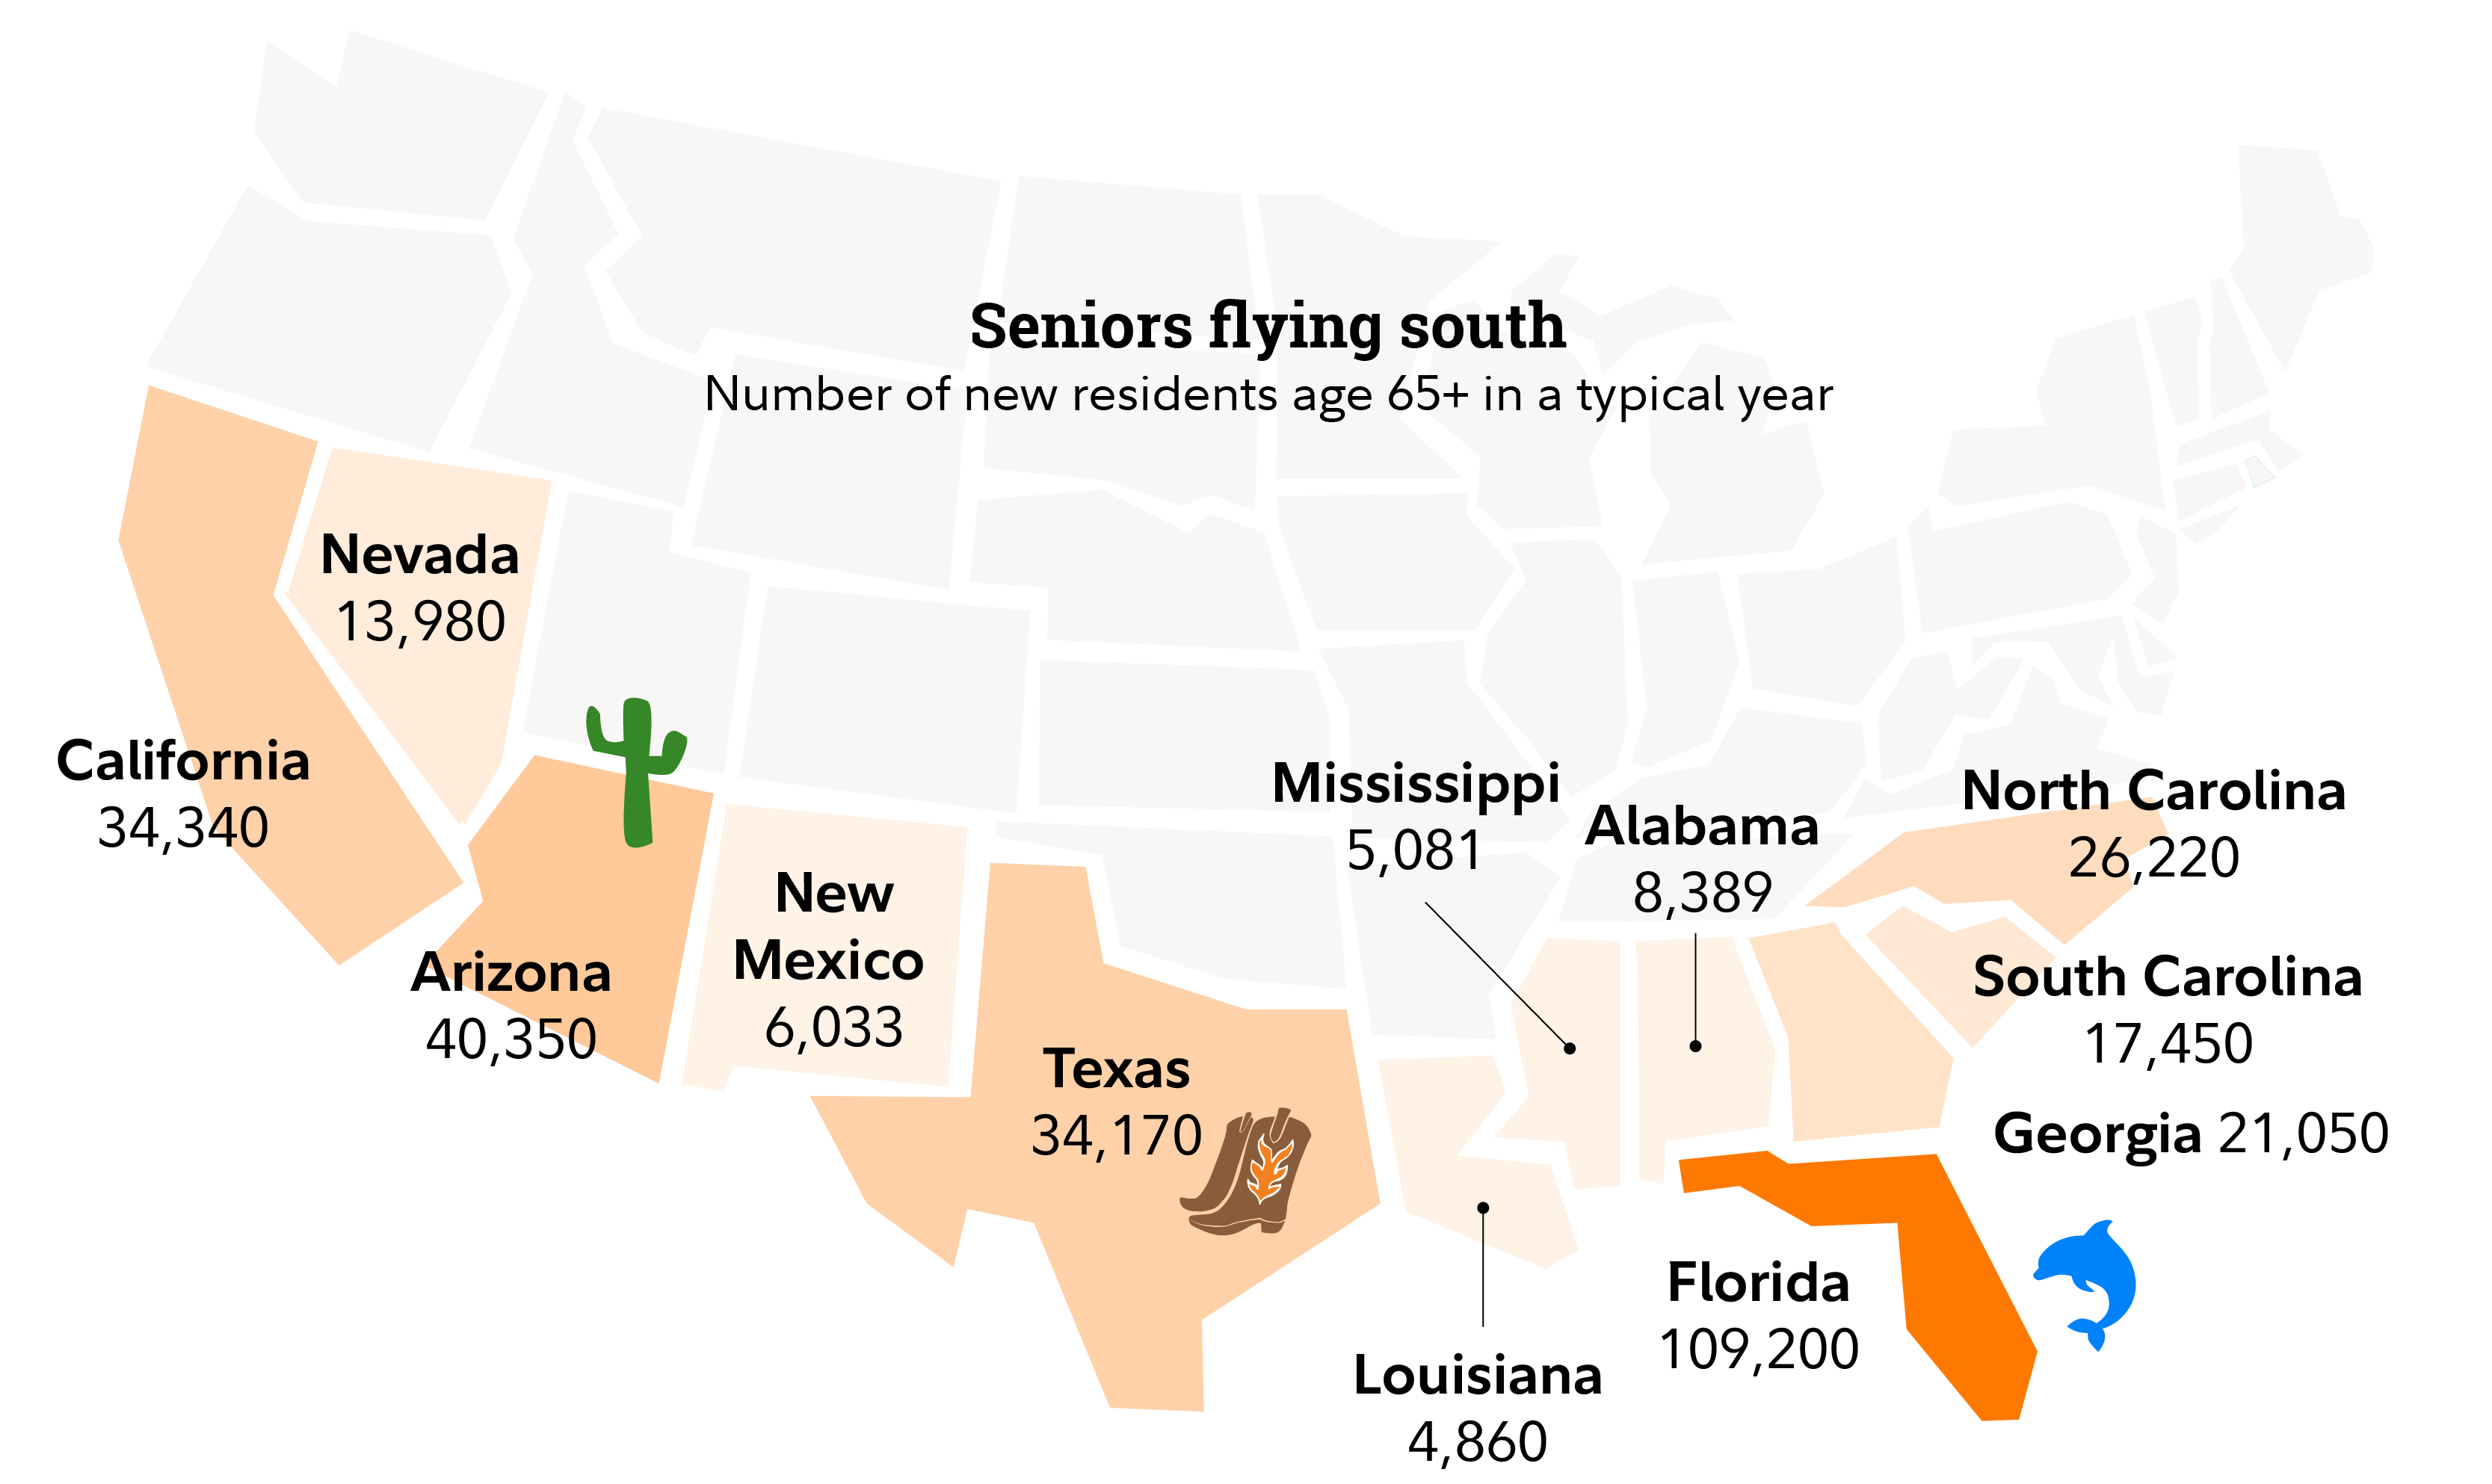
Besides warm weather, most of these states have a reputation for cheaper living costs—but they may not be quite as inexpensive as you might imagine.
To understand the real cost of living in the Sun Belt, we looked at 4 big-ticket essential expenses that vary widely depending on where you live: income tax, property tax, insurance, and home prices. Other costs of living also vary, including sales tax, utilities, and other goods and services, and are worth considering if you’re thinking of making a move.
Here's a look at those 4 big expense categories and how they differ across the Sun Belt states.
Income tax
The first thing most people think of when they hear “retire to Florida” is often, “No state income tax!” While this is true for Florida and 2 other popular Sun Belt retirement destinations—Nevada and Texas—it doesn’t make as much of a difference for retirees as it would for people who are still working.
That’s because all but 9 states will exempt Social Security income from state income tax in 2025. (Those states are Colorado, Connecticut, Minnesota, Montana, New Mexico, Rhode Island, Utah, Vermont, and West Virginia.) So if you are getting a large part of your retirement income from Social Security, you may get a break even if you stayed in, say, New Jersey or Massachusetts.
We crunched the numbers on income tax and came up with average effective tax rates by state for retirement income, including both federal and state income tax. These effective tax rates apply to withdrawals from traditional IRAs, which may receive different levels of tax treatment by state. Social Security income is not included because it is exempt from taxation in most states.
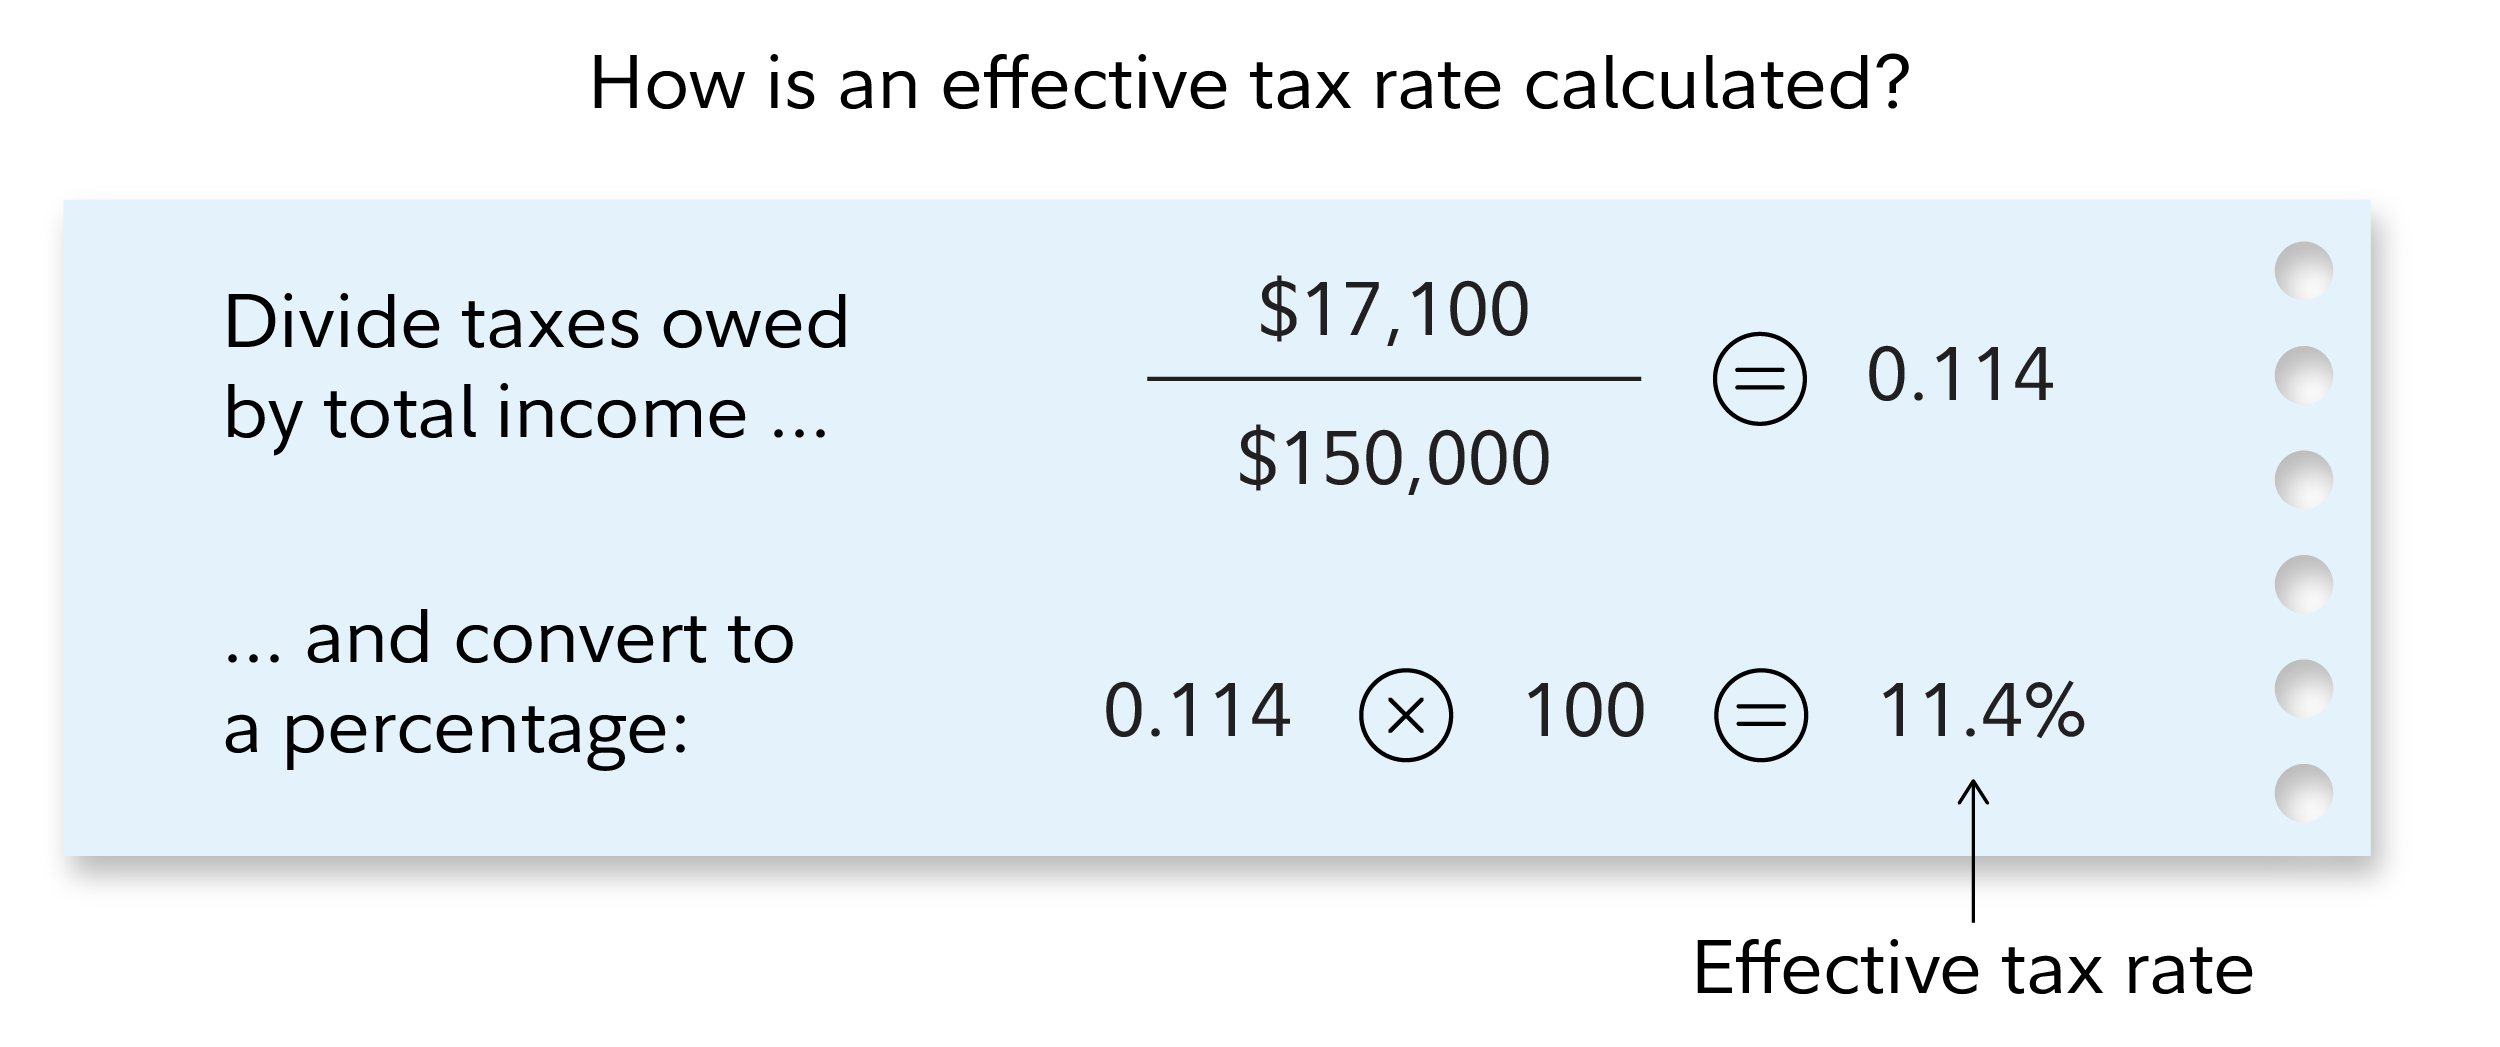
Nevada, Texas, and Florida are at the low end for both married and single filers; that’s because they have no state income tax. But the gap between states with income tax and those without may be narrower than you might expect when focusing on top marginal tax rates.
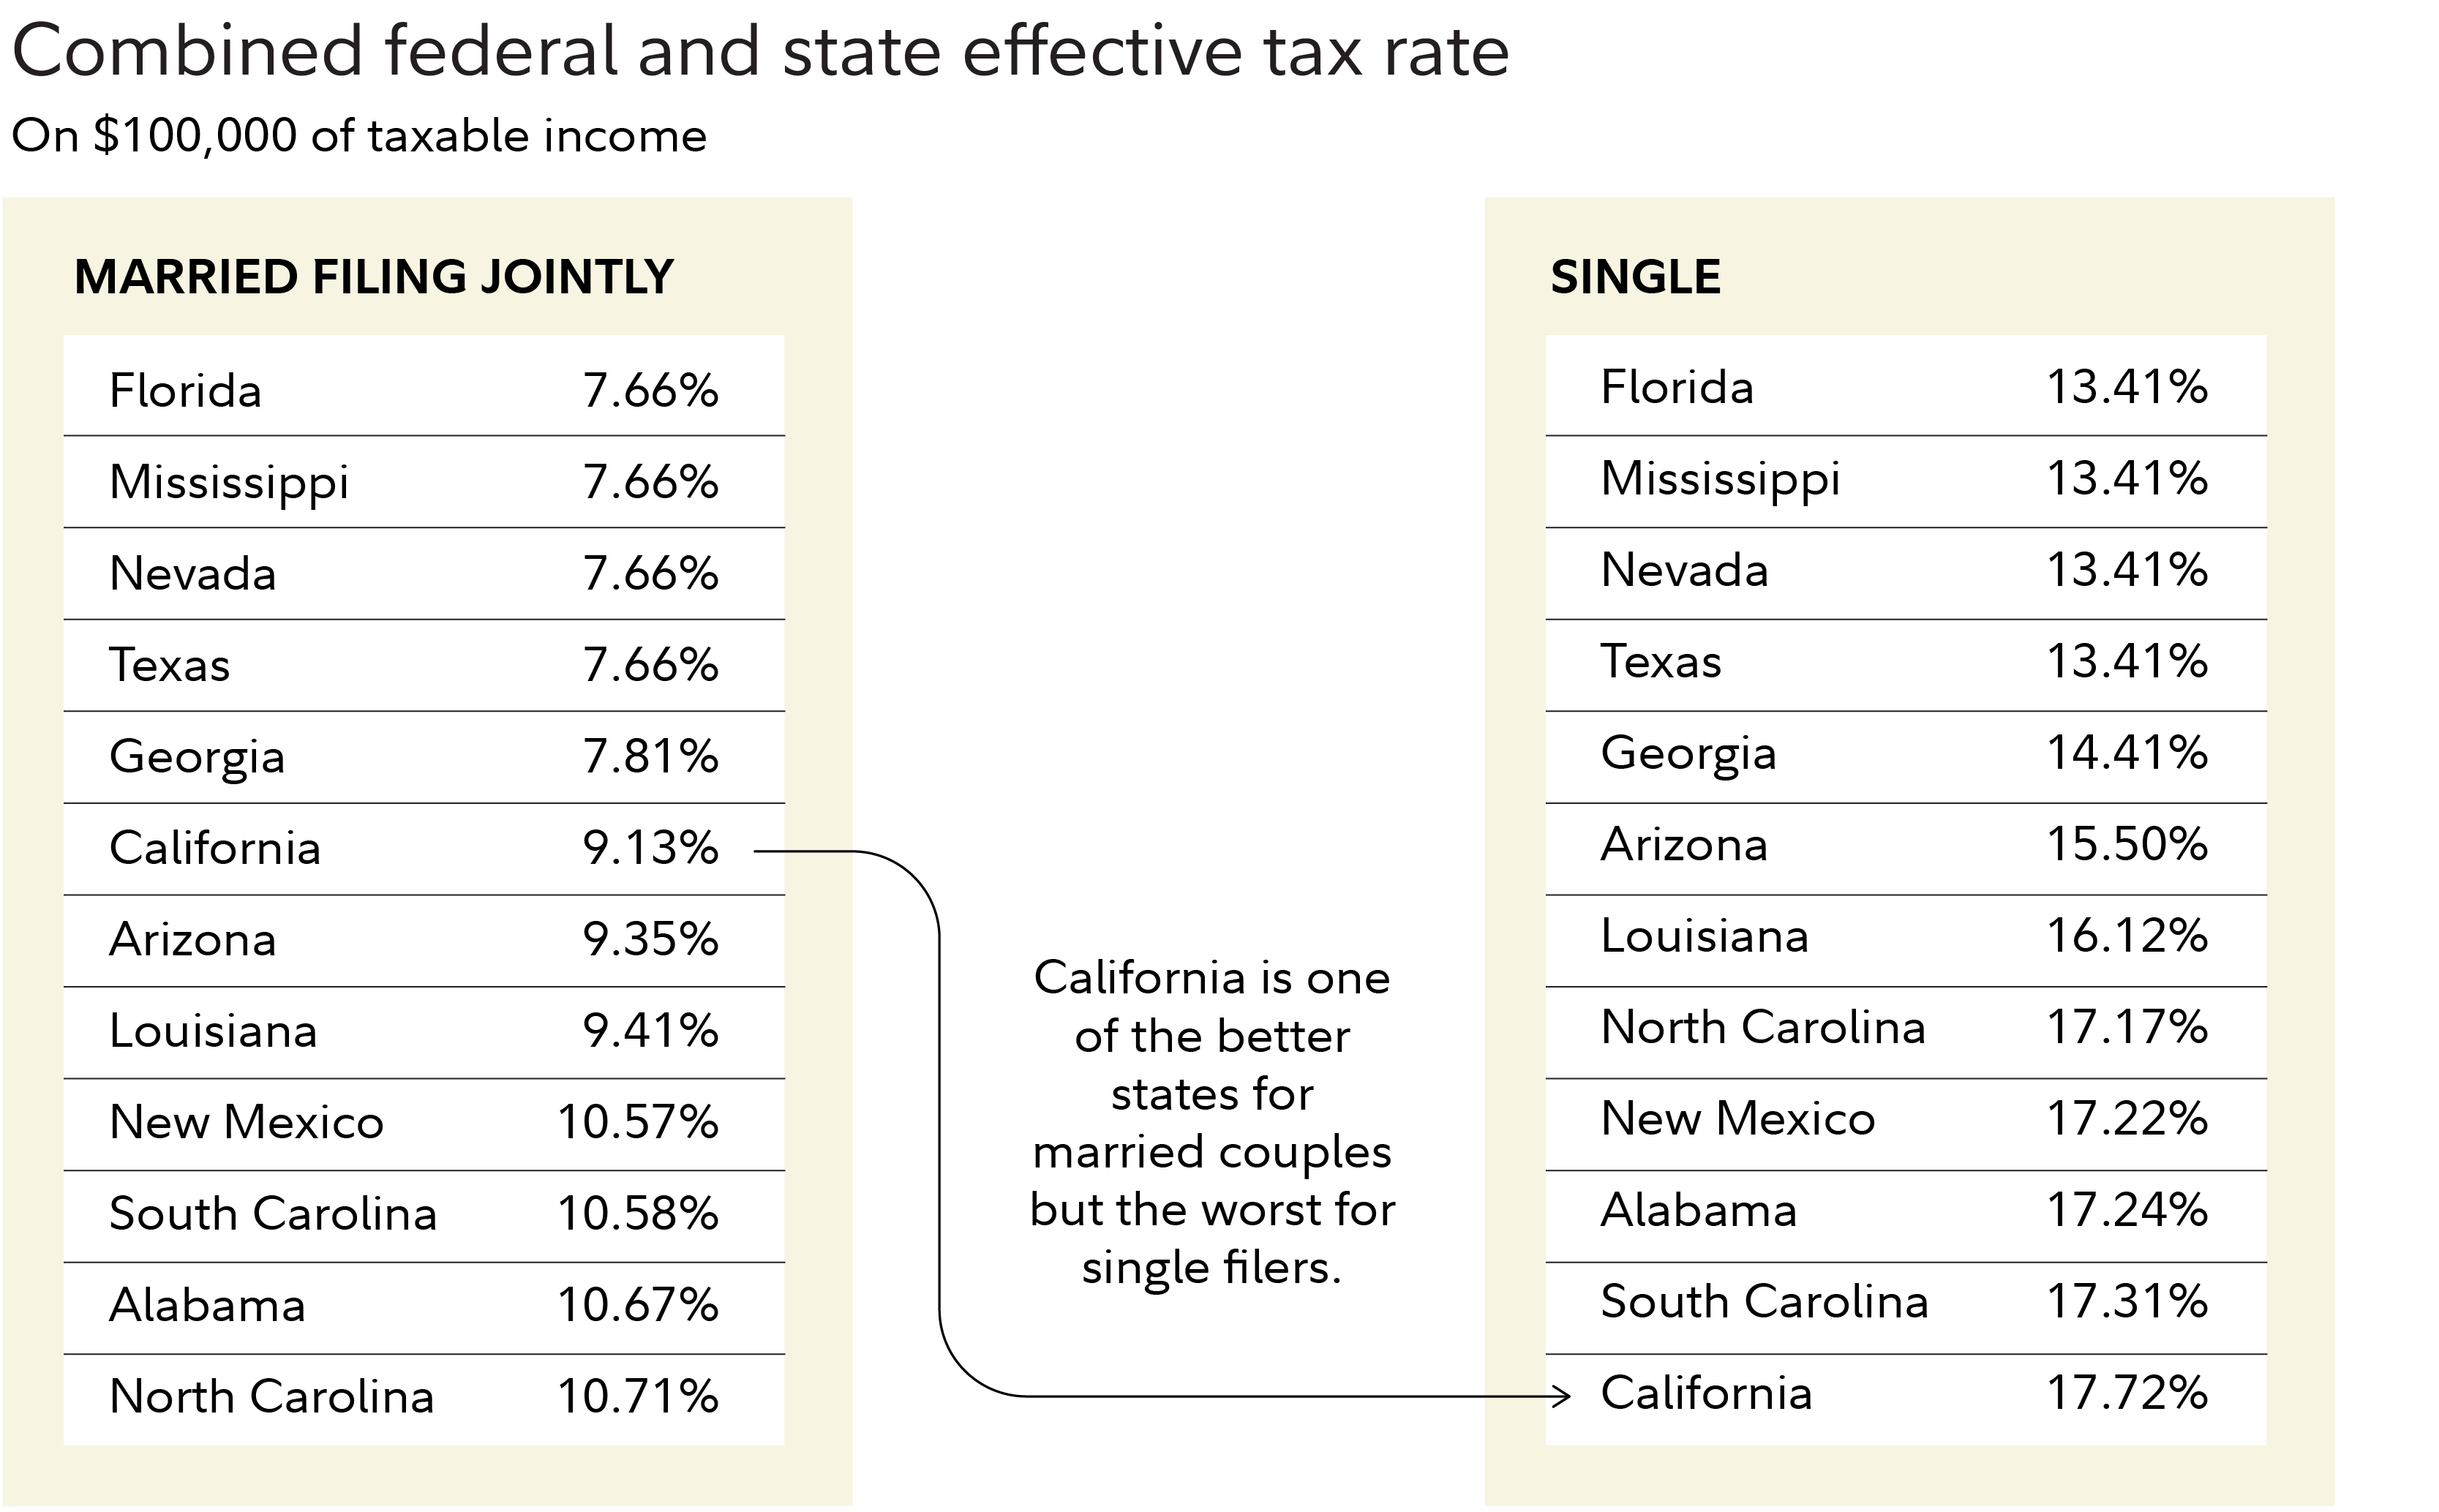
Source: Fidelity
Federal income brackets and state income tax brackets are used. We assume that state adjusted gross income (AGI) is the same as the federal AGI and that the only deduction that applies is the federal standard deduction based on filing status. We assume further that the retiree is age 65 and the additional federal standard deduction for age is included. States may have their own standard deduction or personal exemption amount that differs from the federal amounts. Other credits and deductions are not considered. All data is as of 2024. Tax law may have changed between 2024 and the publishing date of the article. Consult a tax advisor for more information.
Insurance
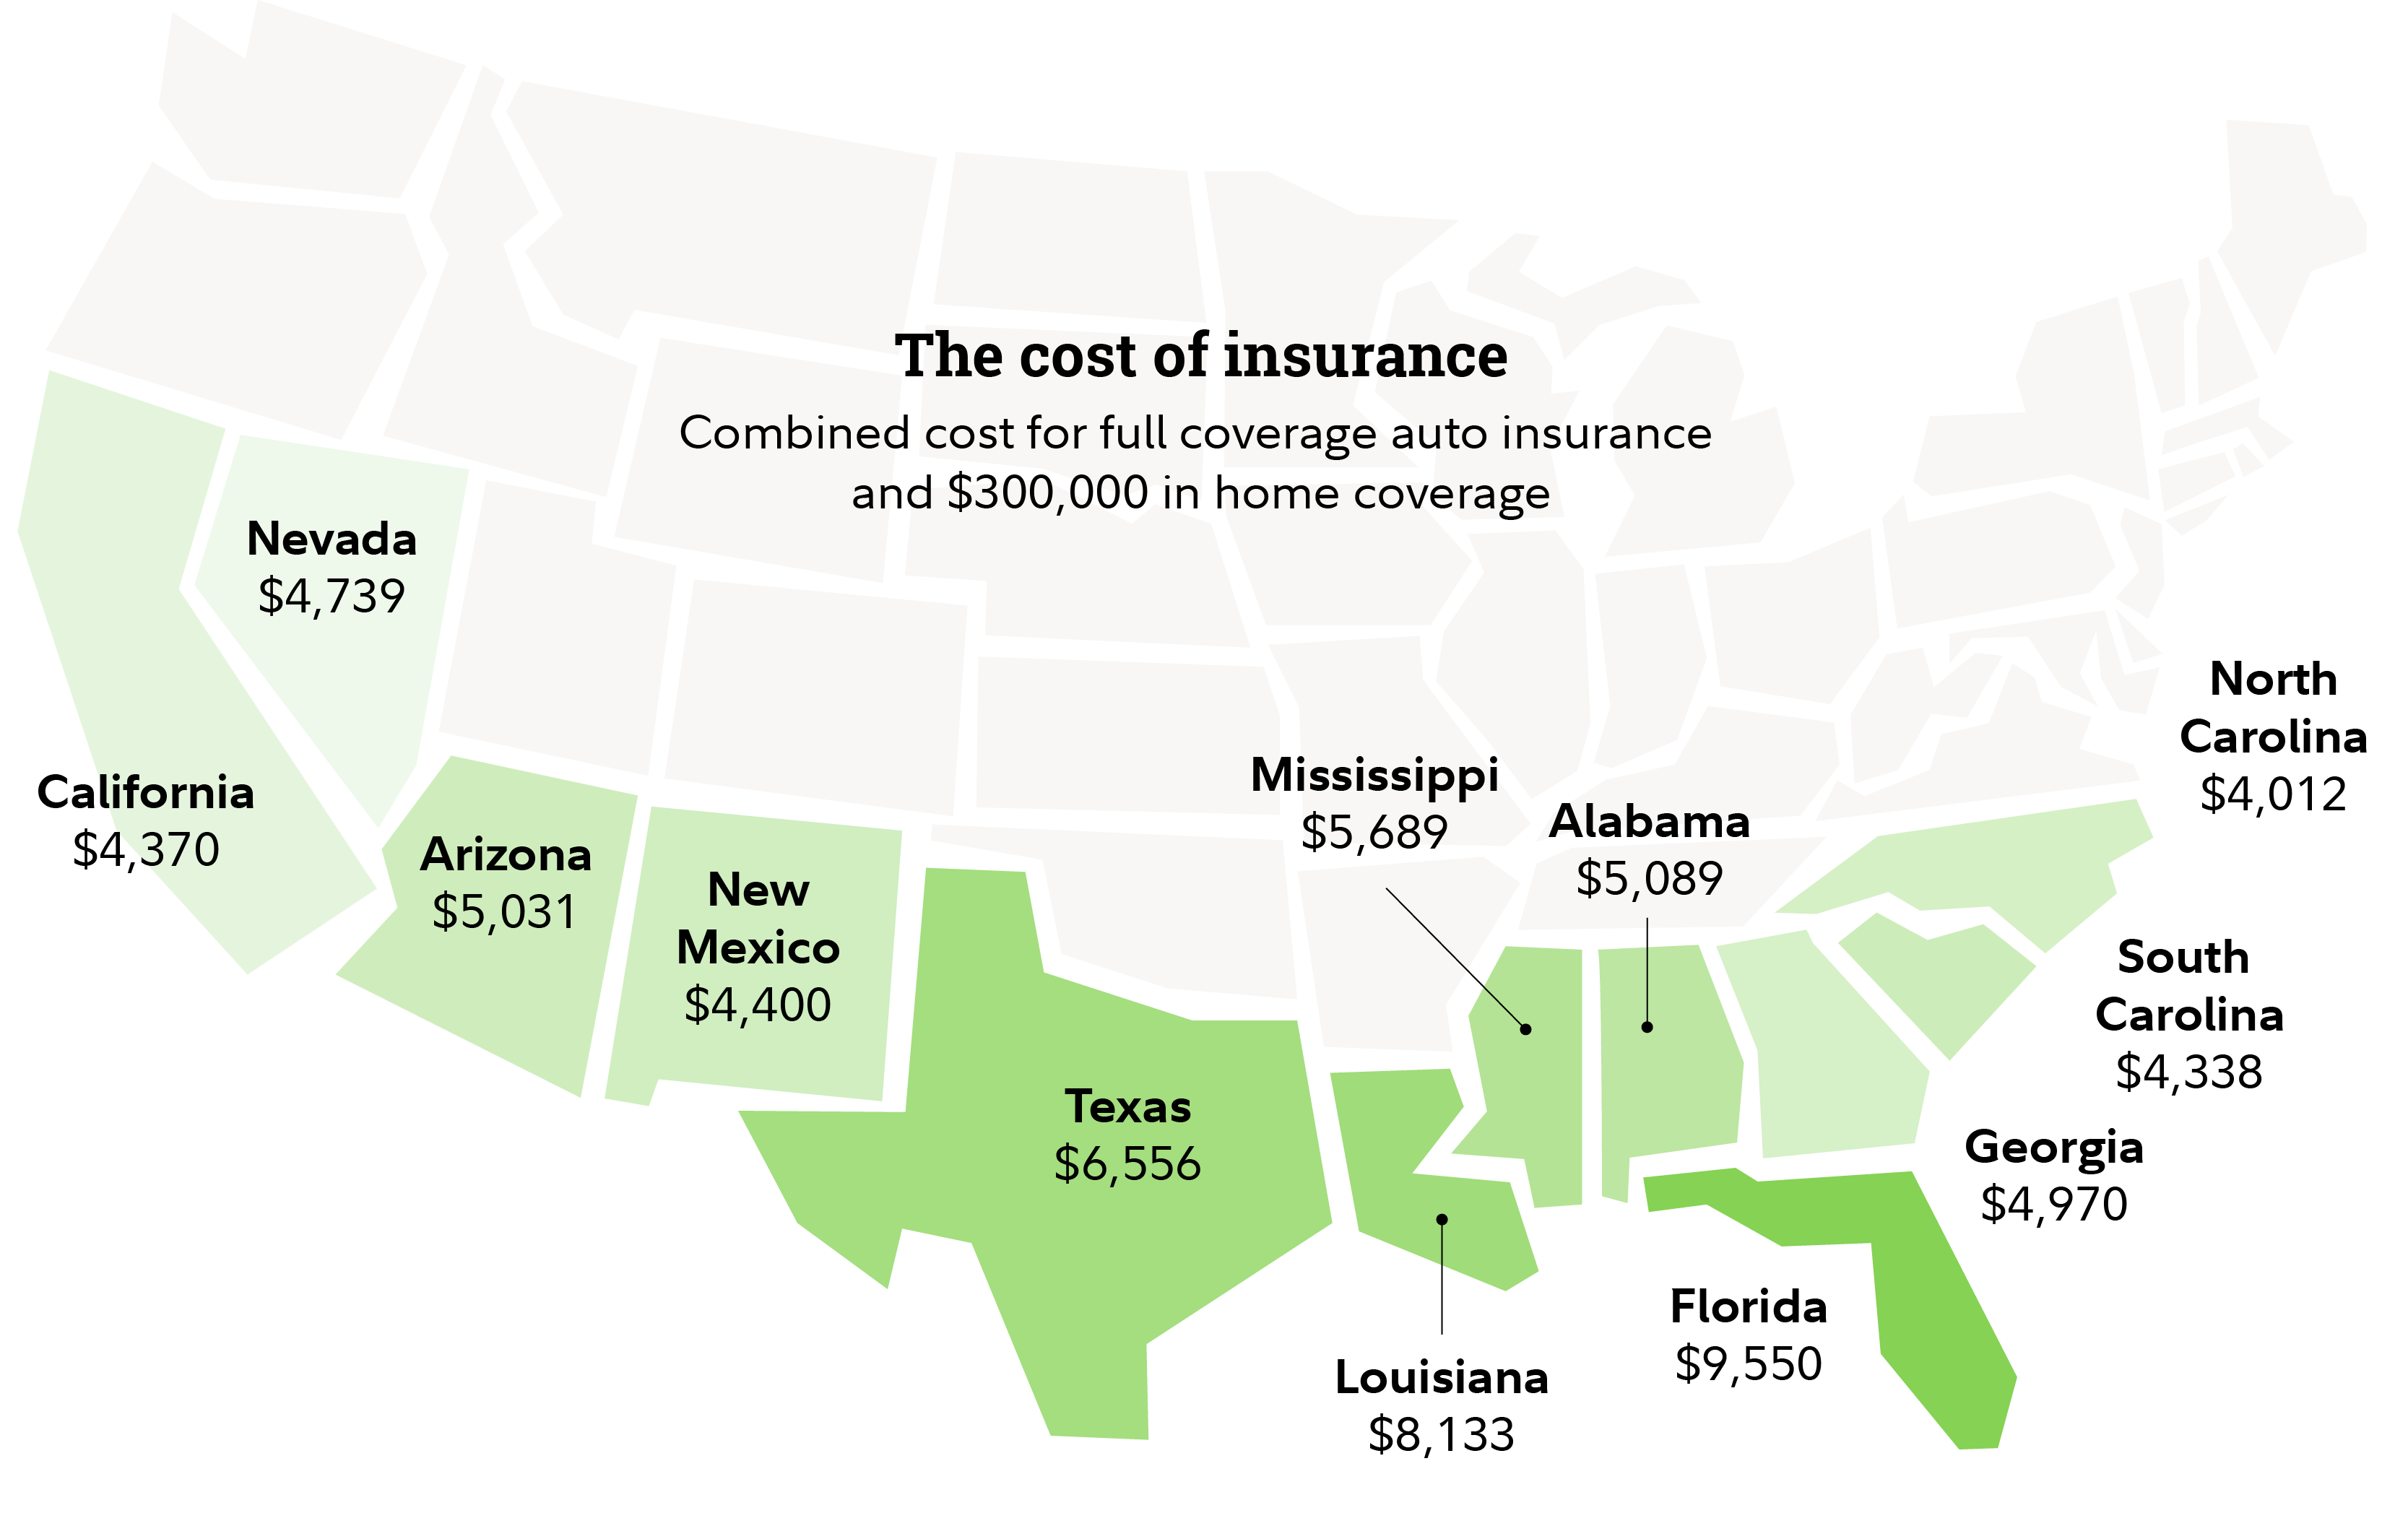
The Sun Belt has some of the country’s best weather, but it also has some of its worst—hurricanes, flooding, and wildfires. The increasing frequency of these disasters has driven insurance costs higher across the South. And it’s not just homeowners insurance. Auto insurance, too, can be more expensive in Sun Belt states.
Florida has the highest average cost for both property and auto insurance among Sun Belt states, according to analysis from Bankrate.com.
And these already-high prices are growing fast. Arizona and Texas have both seen the cost of homeowners insurance rise by more than 35% over the past 2 years, according to S&P Global Market Intelligence. The report found other Sun Belt states have seen increases of 7.5%–22.5% over the past 2 years.
Property tax
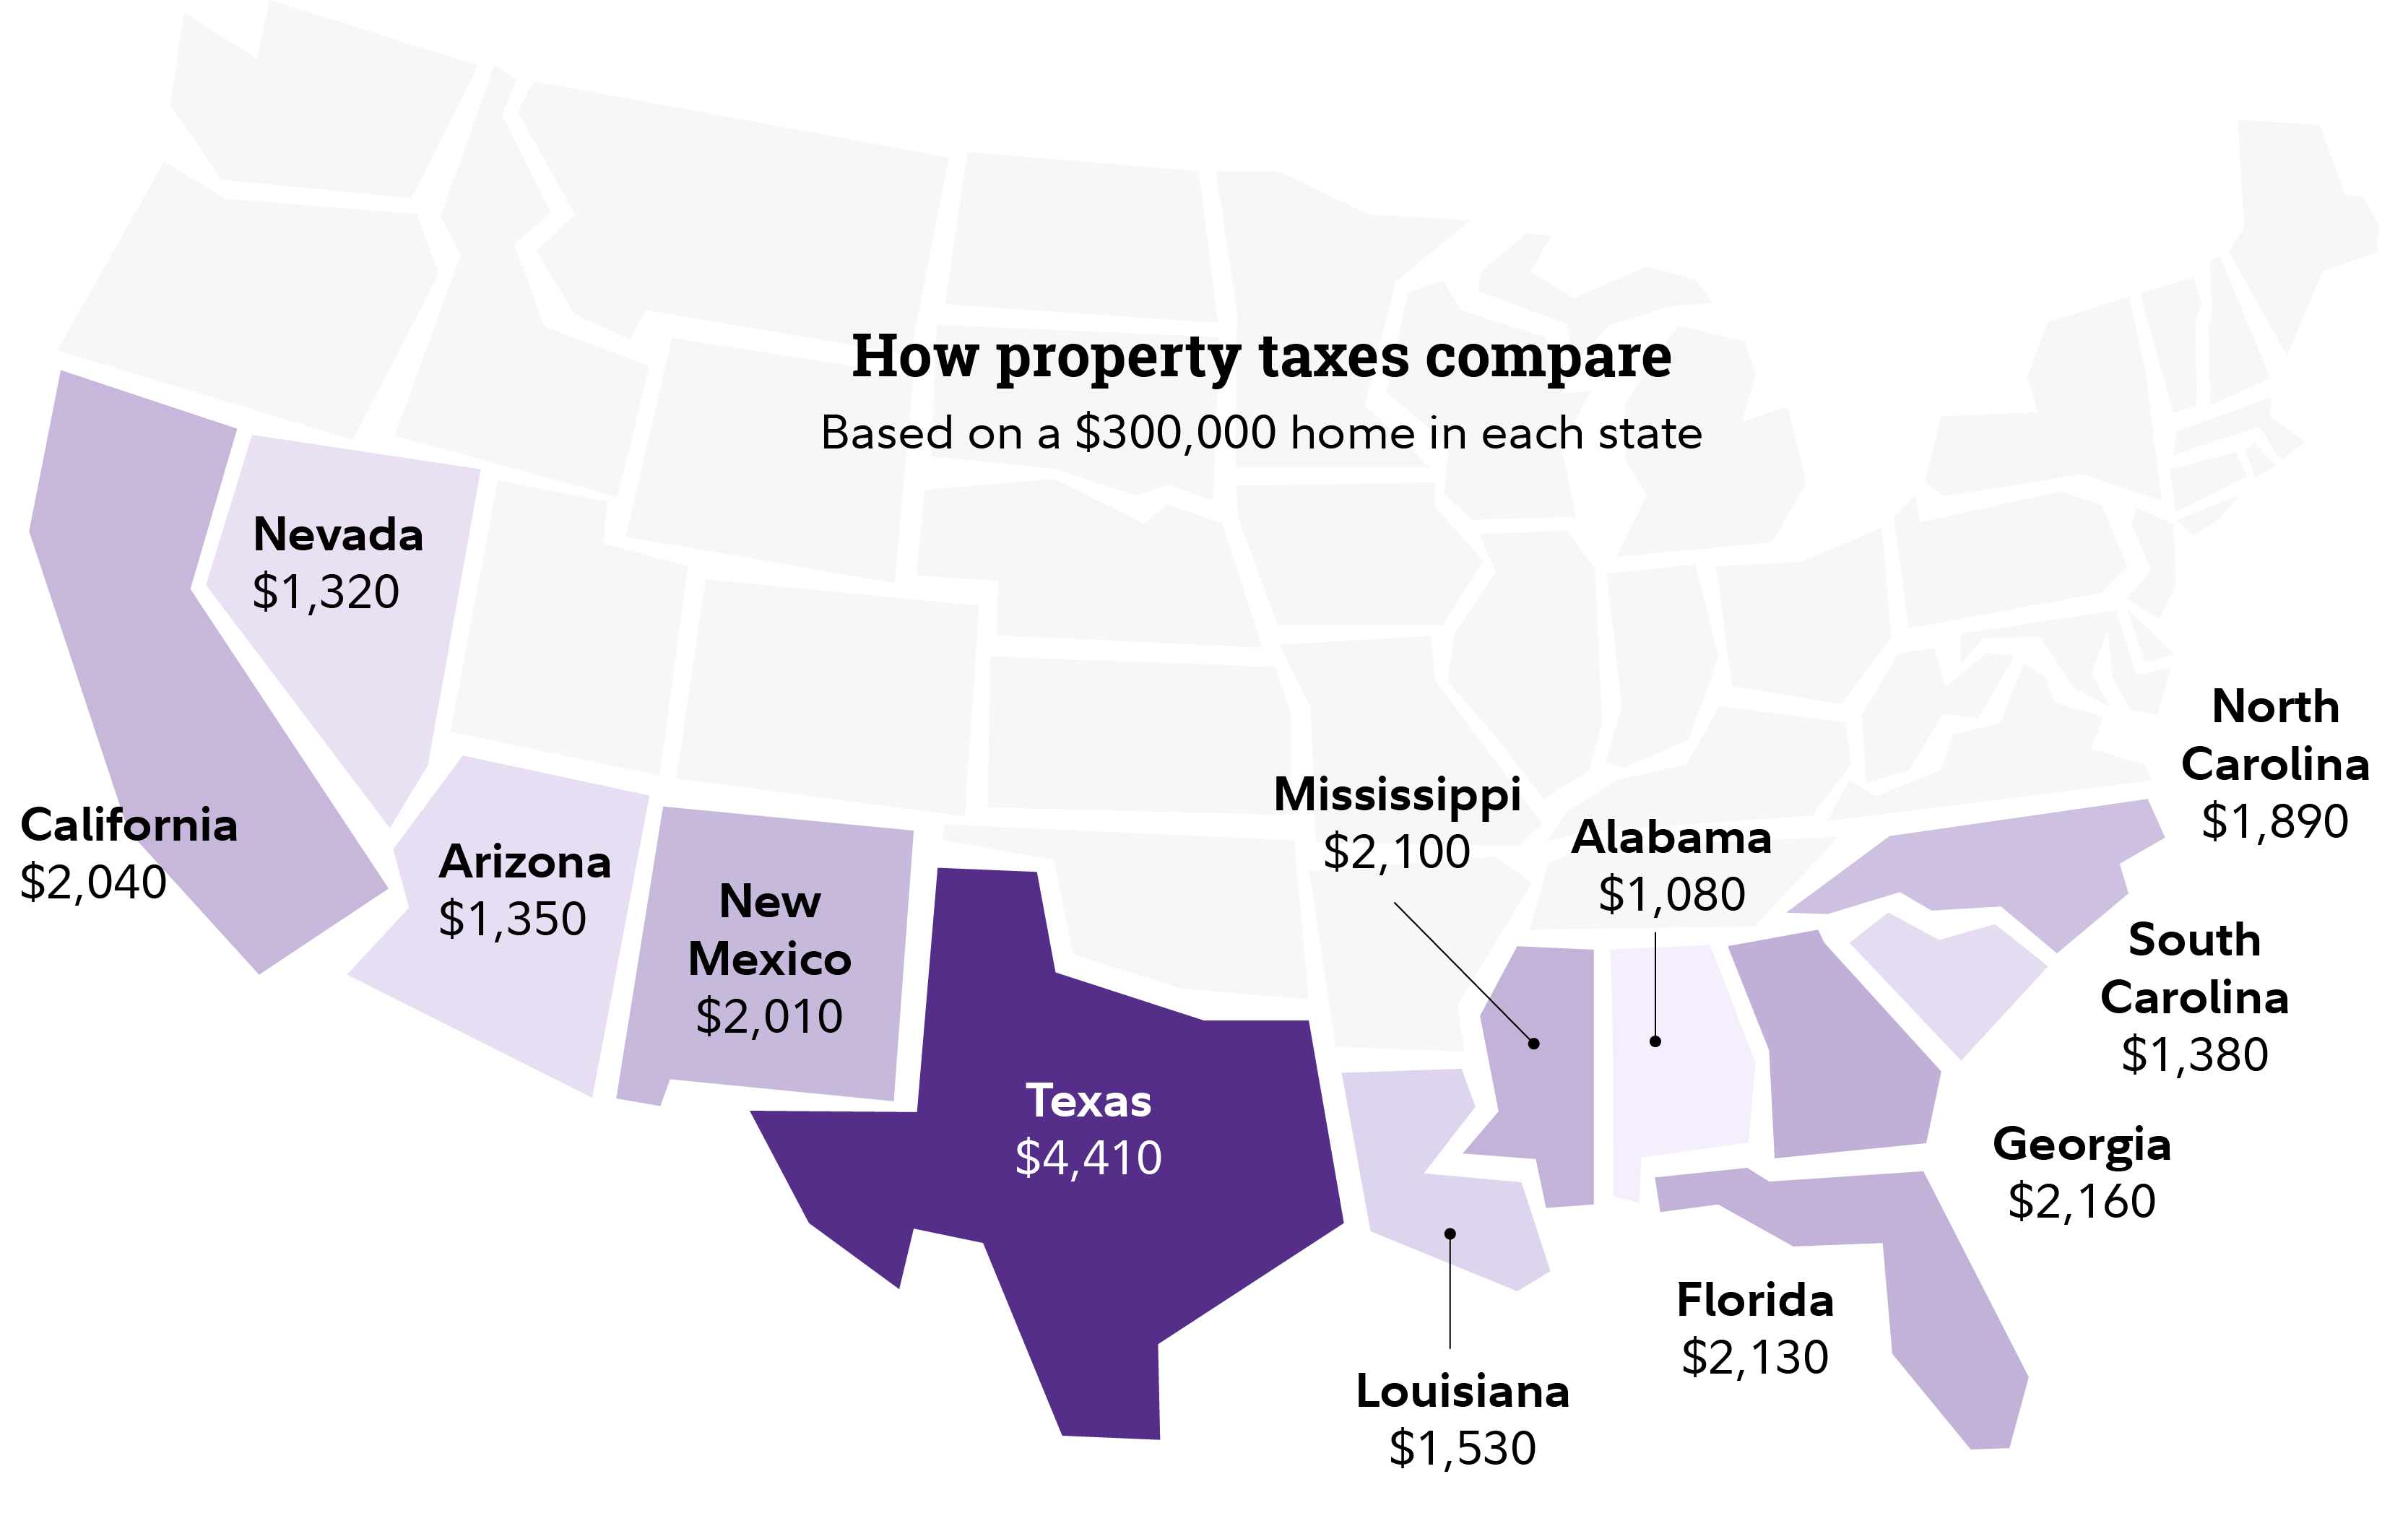
States with low or no income tax often make up for it in other ways, and one of those ways is property tax. The highest property tax rate in the Sun Belt—and one of the highest in the country—is in Texas. A tax bill on a $300,000 home in Texas is double what you might pay for a similar home in California.
Of course, in every Sun Belt state there’s a huge range of homes and communities. Your choice of home will impact your property tax bill, as well as your insurance costs. (More on home prices later.)
It also pays to remember that population growth comes with a cost. A booming population can bring the need for expensive infrastructure improvements, which often mean higher tax rates that may not be baked into the cost of living—yet.
Hypothetical examples
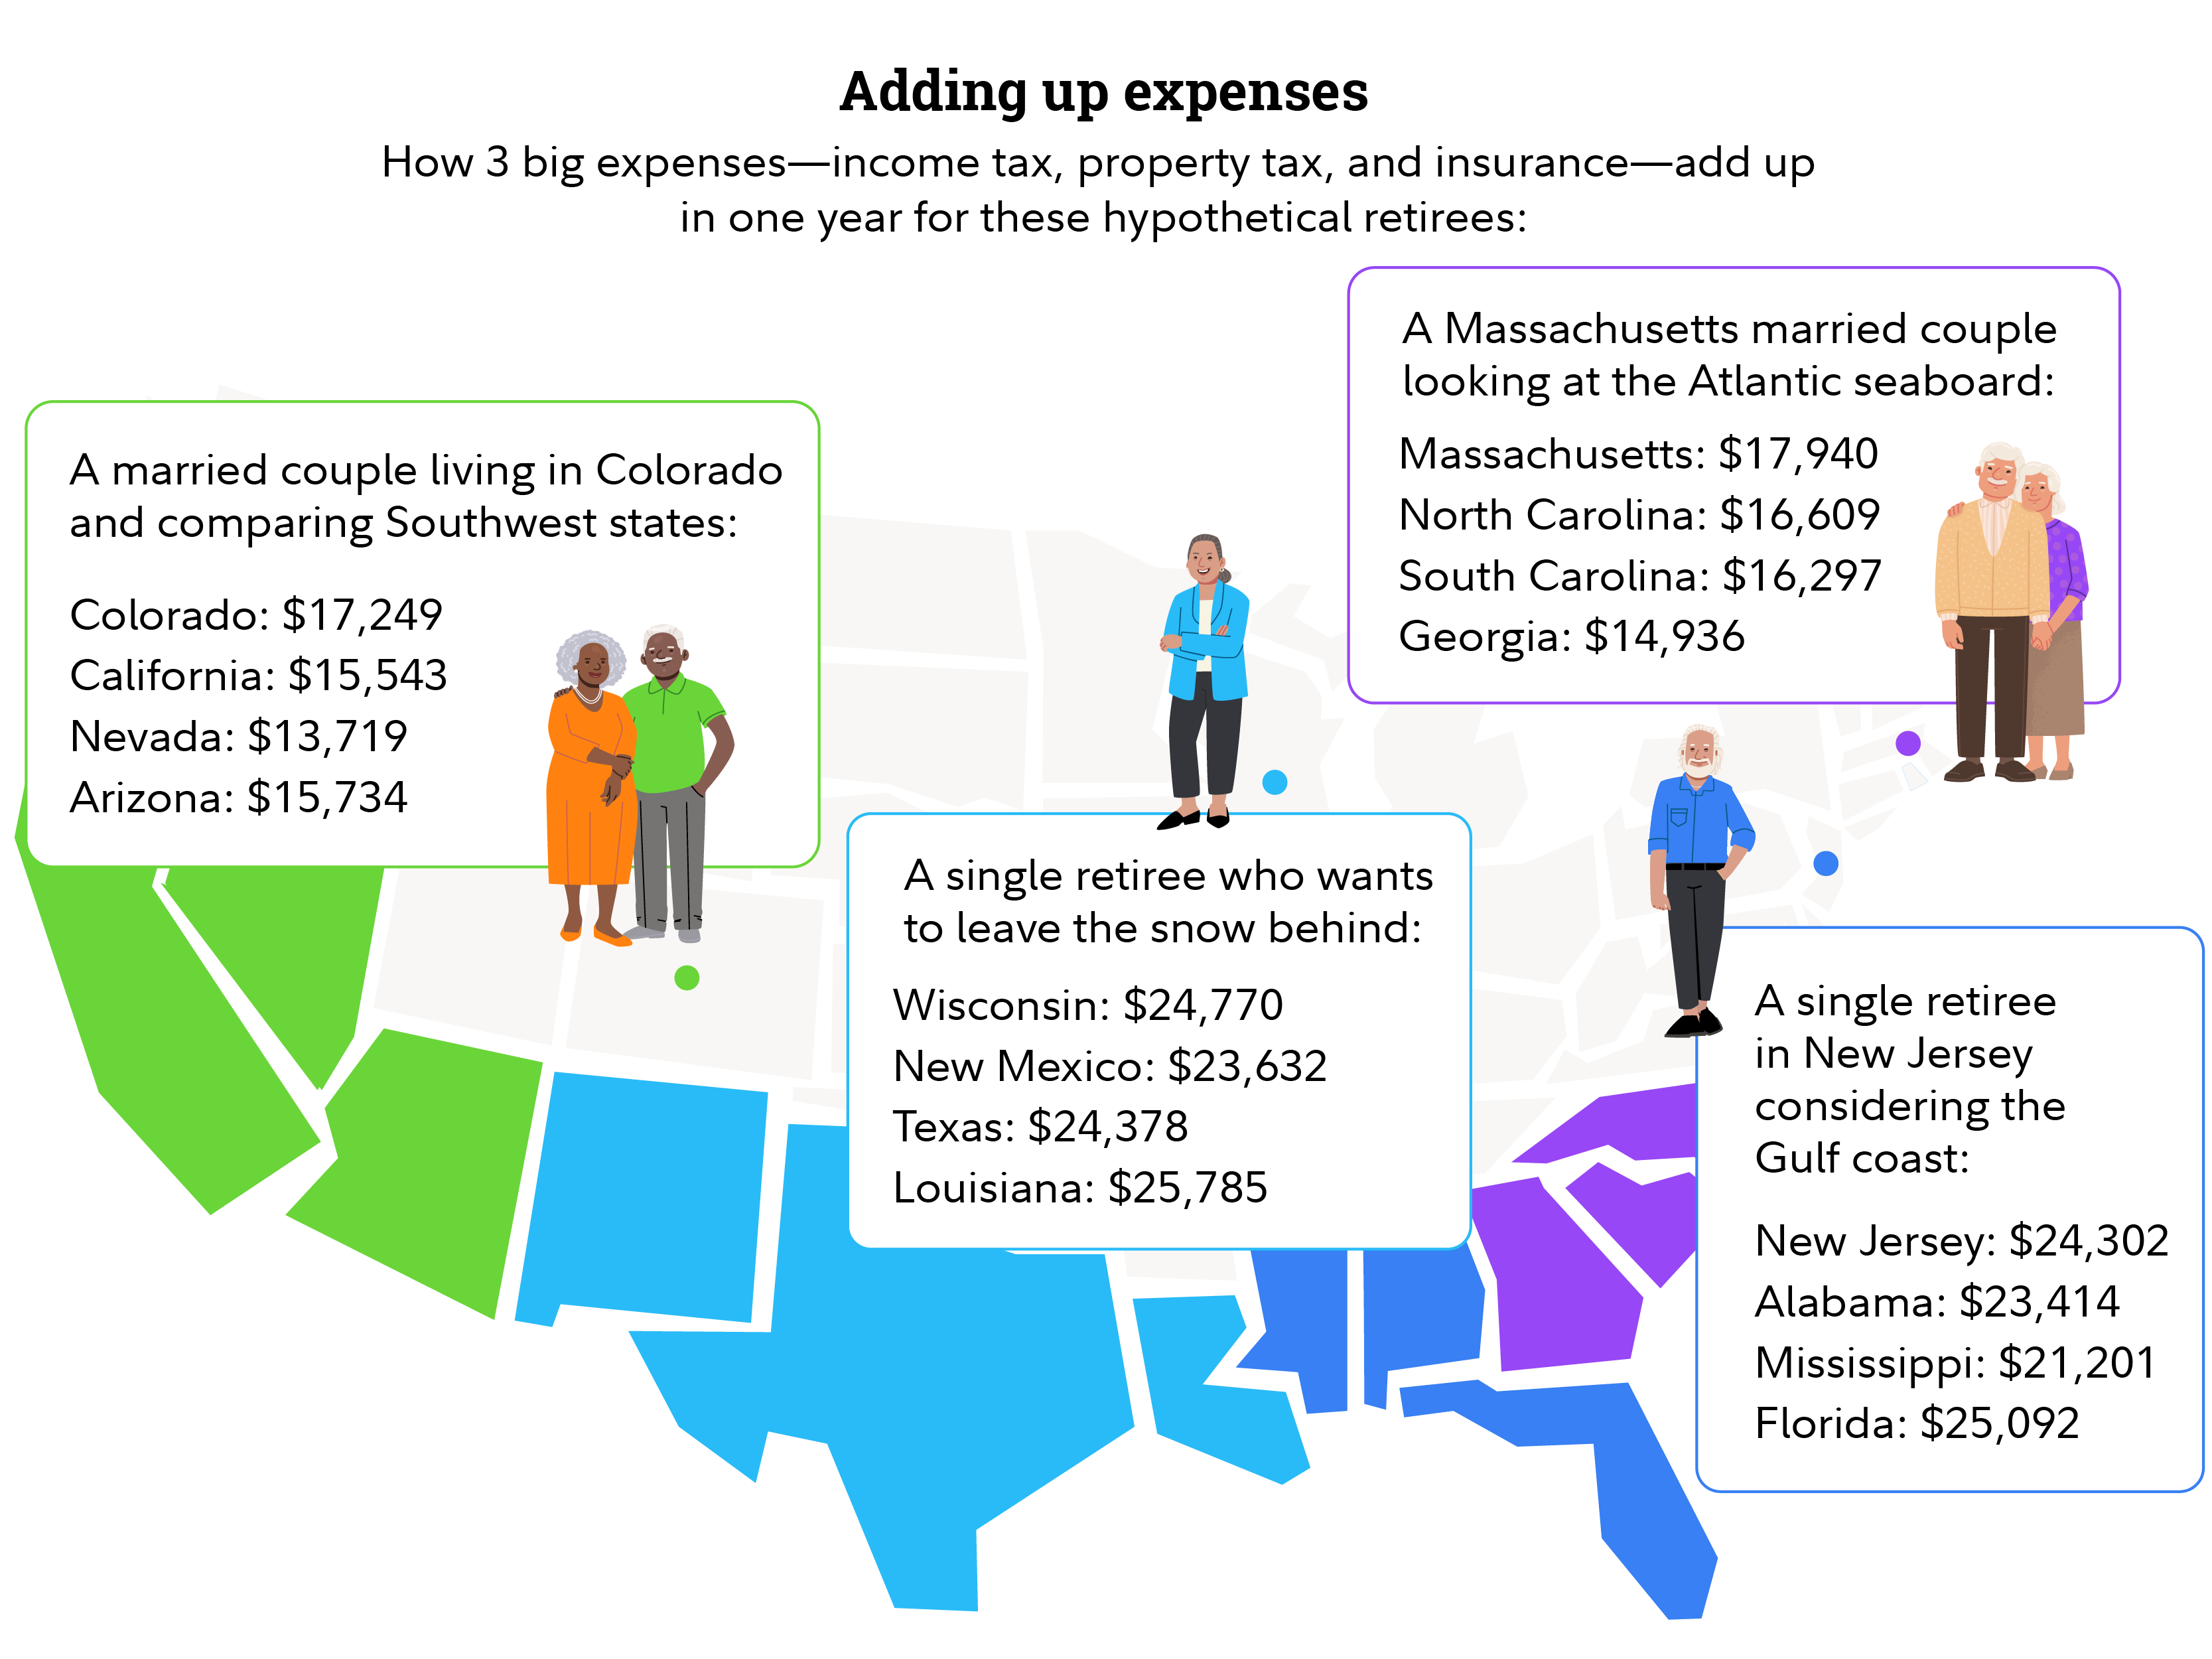
Could you live cheaply in Florida, even if insurance is expensive? Of course. Your personal choices matter at least as much as the average costs we’ve shared here. Perhaps you could cut costs by getting by with only one car, downsizing into a condo, or renting an apartment. But you might also like to live in a walkable town near medical care, which could be quite pricey.
It also matters where you’re moving from. If you’re moving from a low cost-of-living state, you might find yourself paying significantly more to live in a Sun Belt state. The math looks better if you’re currently living in a more expensive location.
Here are 4 examples of singles and couples and how their costs might compare. In all cases, we’ve assumed they’re moving to a comparably priced home:
Home prices
One more key to your real cost of living—and an important lever you can control when it comes to insurance and property tax costs—is the home you buy.
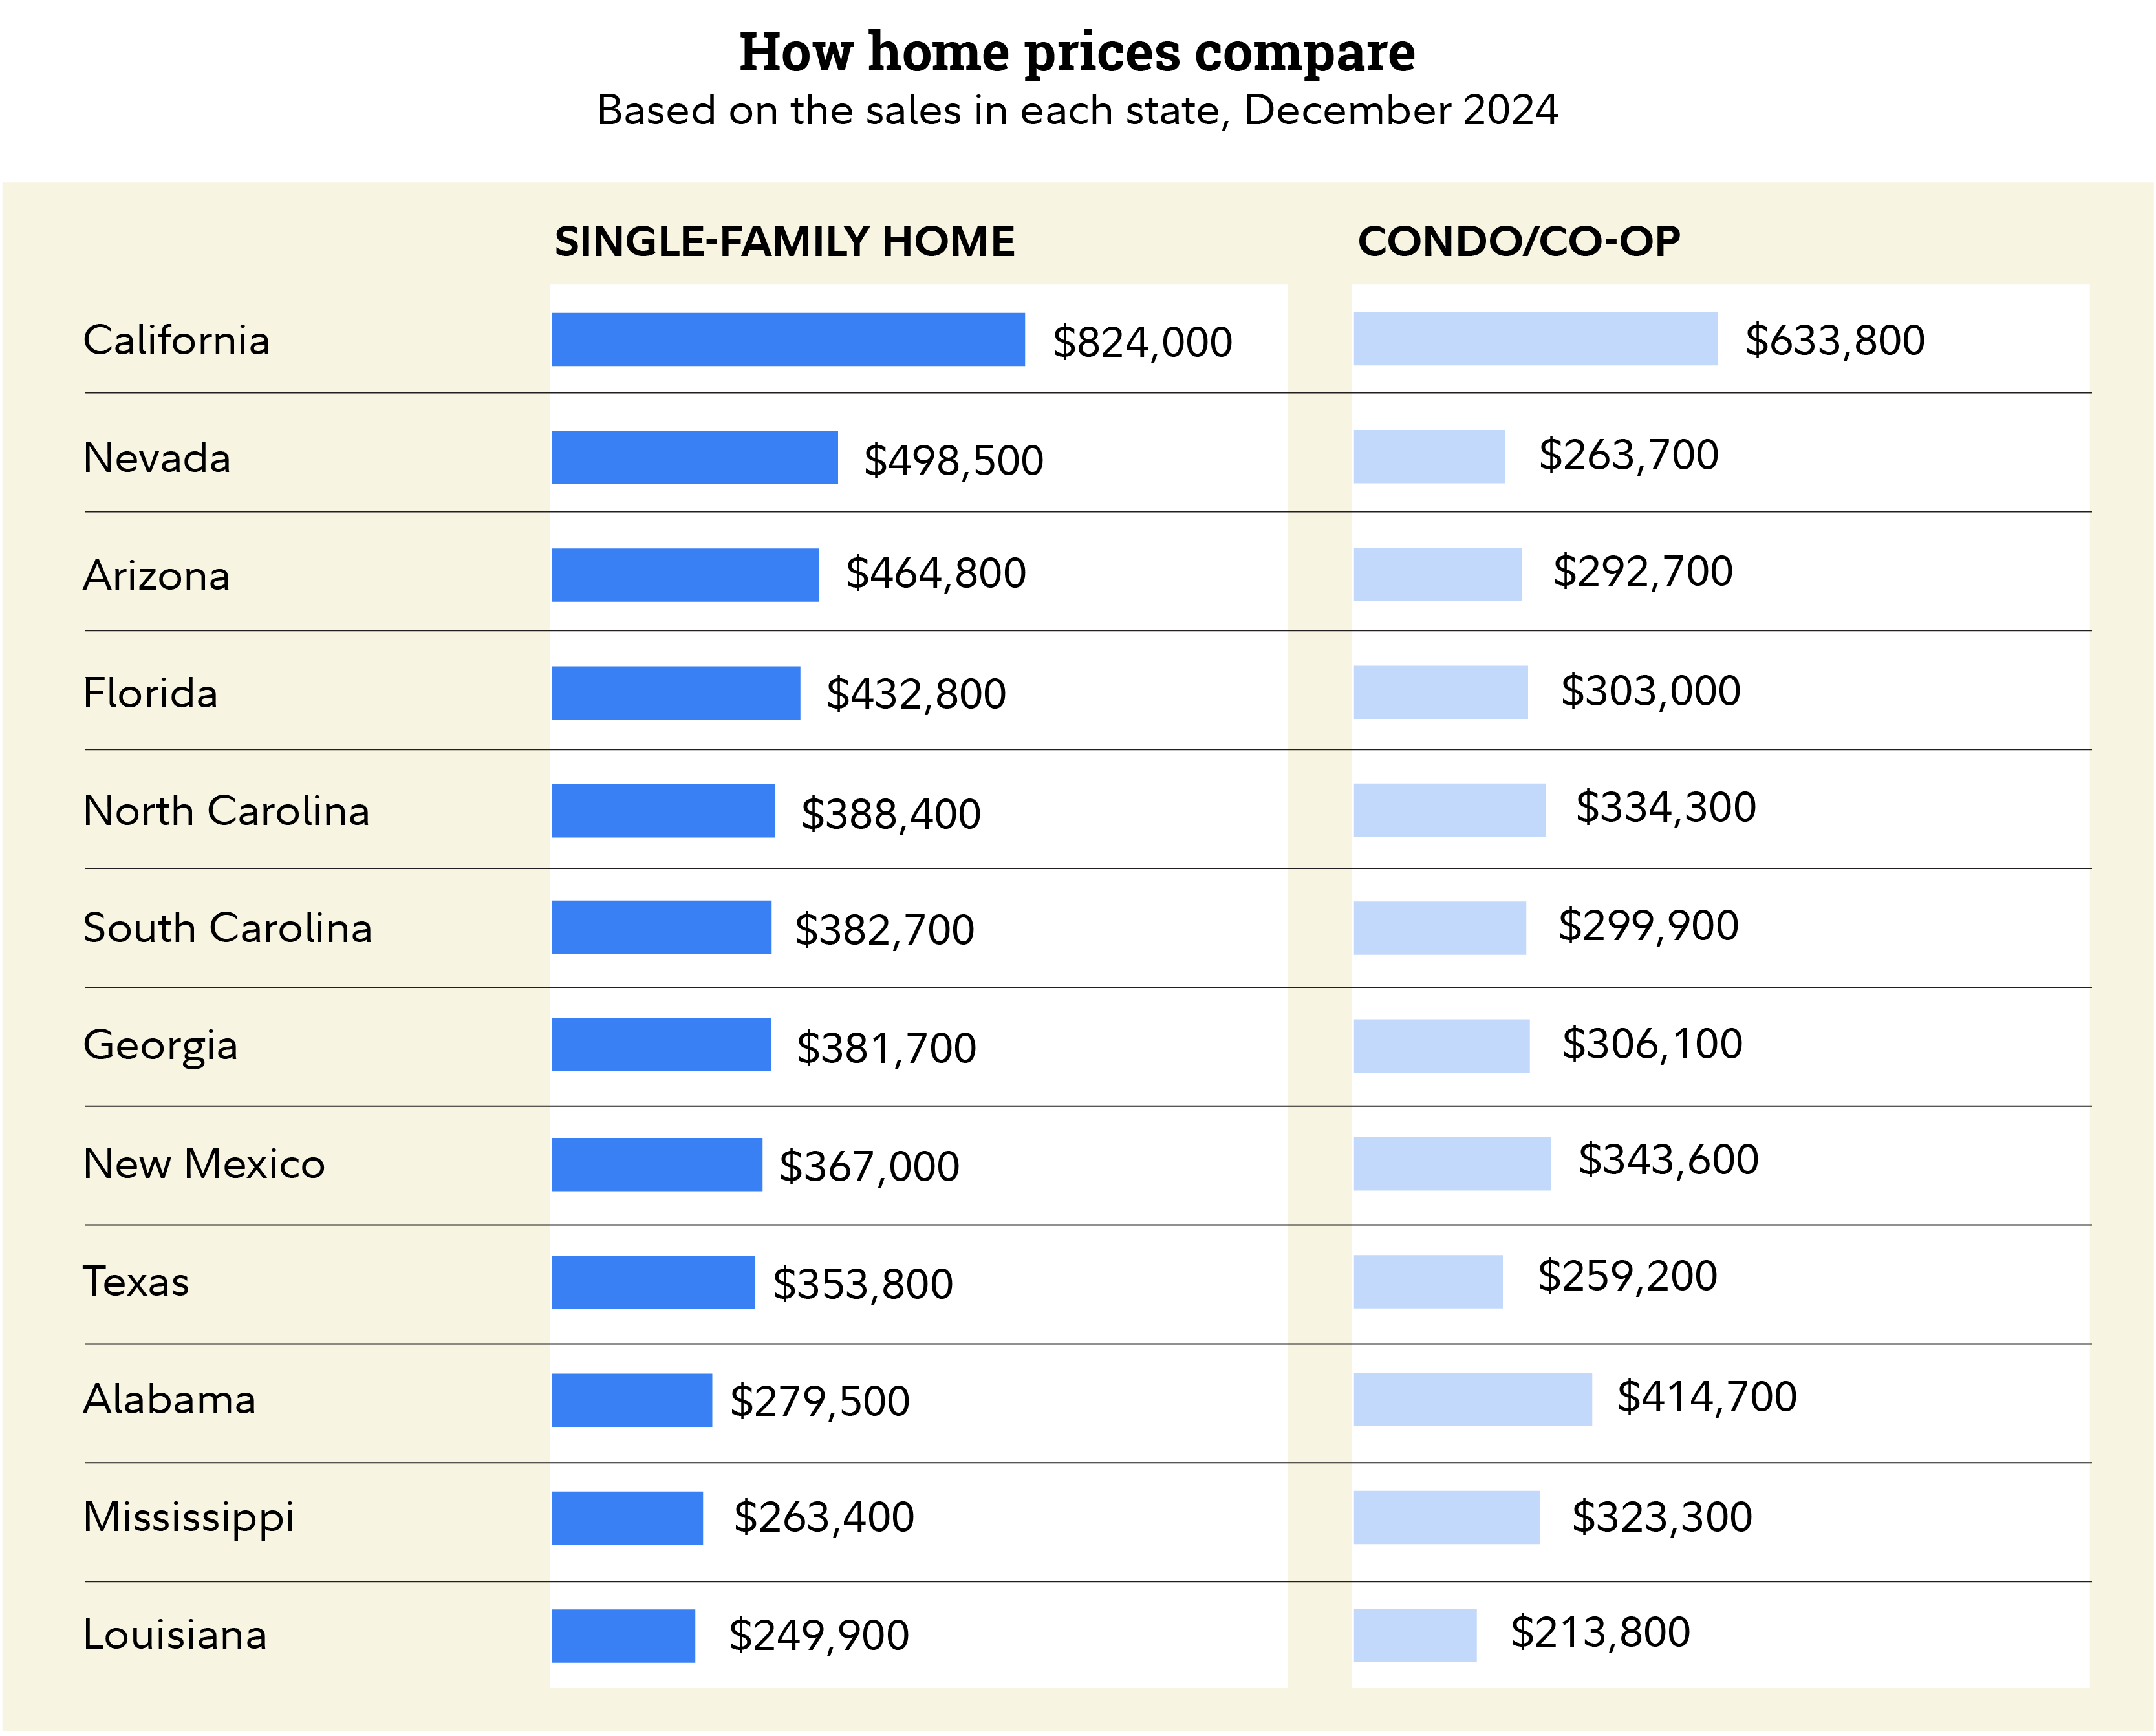
The average price for a single-family home across the Sun Belt ranges from about $250,000 in Louisiana all the way up to $824,000 in California, according to Redfin, a national real estate brokerage.
Closest to the national average? Florida, where the average cost of a home was $432,800 in December, compared to the national average of $443,000.
Whether you can find an inexpensive home in one of these states depends a lot on what you want—condo or single-family home? City or country? Could you find a $175,000 retirement home in Florida? Yes. Would it be in a desirable neighborhood? That’s a different question.
The bottom line
Of course, the main driver of where to live in retirement isn’t just the cost of living. There are a host of reasons to move or to stay put: better weather, proximity to family and friends, finding a community that feels like home. The reasons are personal, and so is the value you place on them.
Working with a financial professional and tax advisor can help you understand how a move would impact your investment portfolio and tax situation, so you can feel more confident in your ultimate decision.


