
Description
Relative Strength Comparison compares two securities, or a security and an index, to show relative performance to each other.
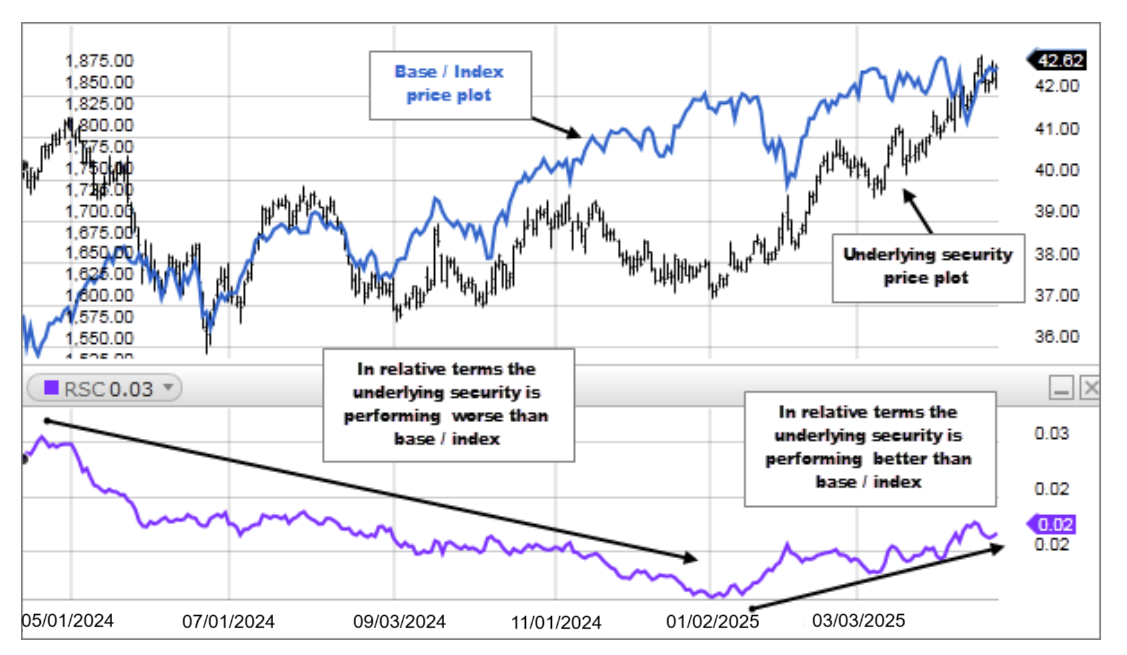
Relative Strength Comparison compares a security's price change with that of a "base" security or index. When the Relative Strength Comparison indicator is moving up, it shows that the security’s price is performing better than the base security/index in relative terms. When the indicator is moving sideways, it shows that both securities prices are rising and falling by the same percentages. When the indicator is moving down, it shows that the security’s price is performing worse than the base security/index in relative terms.
Relative Strength Comparison is often used to compare a security's performance with a market index.
The Relative Strength Comparison indicator is calculated by dividing one security's price by a second security's price (the "base" security). The result of this division is the ratio, or relationship, between the two securities.