
Description
The Negative Volume Index (NVI) is a cumulative indicator, developed by Paul Dysart in the 1930s, that uses the change in volume to decide when the smart money is active. The NVI assumes that smart money will produce moves in price that require less volume than the rest of the investment crowd.
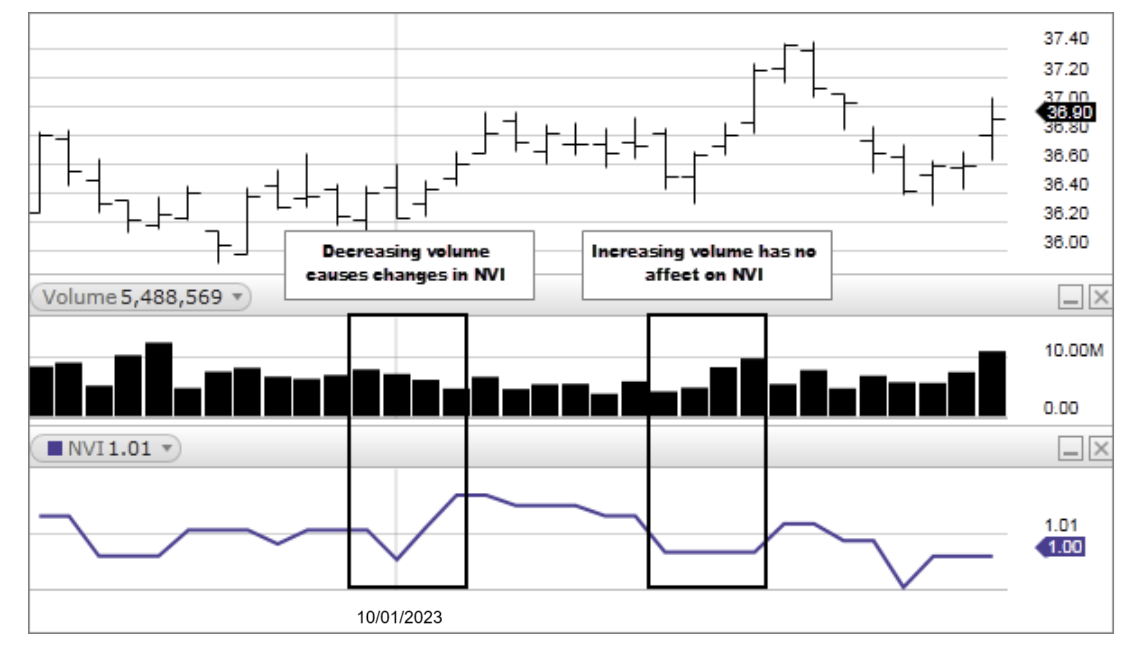
NVI rises on days of positive price change on lower volume, NVI falls on days of negative price change on lower volume, and NVI is unchanged on days of higher volume no matter what the price action.
How this indicator works
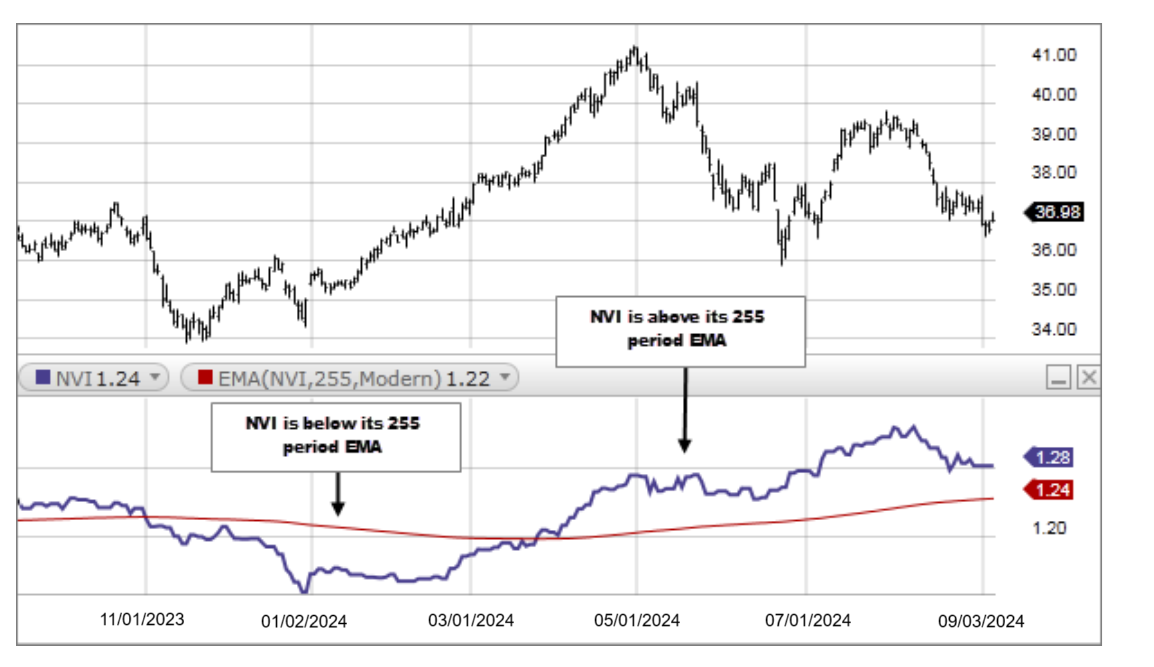
Norman Fosback, of Stock Market Logic, compared NVI with its one-year (255bar) moving average. When NVI is above the moving average, he calculated that there is a 96% chance that a bull market is in progress; when NVI is below the average, there is a 53% chance of a bear market. As with all indicators, NVI should not be used on its own. Instead, chartists should use it in conjunction with other analysis techniques.
Calculation
If today's volume is less than yesterday's volume then:
")
If today's volume is greater than or equal to yesterday's volume then:
")
Because falling prices are usually associated with falling volume, the NVI usually trends downward.