Forecasts and objectives can change
Have you ever started out for the grocery store and ended up going to a movie instead? Something similar can happen with a covered call.
Imagine that you confidently buy XYZ stock at $53.00 per share hoping for it to rise modestly, and simultaneously sell a 60-day XYZ 55 call, hoping for an attractive static rate of return and possibly an even better if-called rate of return. But then you read an article touting XYZ’s long-term growth prospects, and your outlook changes. You now believe that XYZ stock could rise as high as $70.00 in 6 months. The stock that you initially purchased hoping for a profit of 4%-5% in 60 days has now become a possible big mover and a possible long-term holding. What should you do?
As another example, consider an “income trade gone bad.” Thirty days ago you purchased QRS stock at $79.50 per share, expecting the stock to trade sideways for 60 days. At that time you simultaneously sold a 60-day QRS 80 call for $3.00 per share. If QRS had just stayed near $80.00, you could have made a profit. But then QRS started to decline as the entire market sold off. With QRS now trading at $74.50, down $5.00 from your purchase price, you are losing more on the stock than you received for selling the covered call. What are your alternatives?
These are just 2 of many examples in which a covered call position, with an initial forecast and an initial objective, encountered some change. Perhaps it is a change in the objective, as in the first example. Perhaps the forecast was wrong, as in the second example. Regardless of what has changed, the new situation must be addressed. Should the investor take action? If yes, what should the action be?
Introduction to rolling and subjective considerations
The concept of “rolling” is that the covered call you sold initially is closed out (with a buy-to-close order) and another covered call is sold to replace it. There are many possible reasons for rolling a covered call. Suppose, for example, that the stock price rose above the strike price of the covered call. If you do not want to sell the stock, you now have greater risk of assignment, because your covered call is now in the money. You therefore might want to buy back that covered call to close out the obligation to sell the stock. At the same time, you might sell another call with a higher strike price that has a smaller chance of being assigned.
Alternatively, the stock price could have declined in price. If your intention was to earn income from selling calls, then you could have a loss if the stock price keeps falling. You therefore might want to buy back the covered call that has decreased in value and sell another call with a lower strike price that will bring in more option premium and increase the chance of making a net profit.
When the stock price does not move as forecast, when the forecast changes, or when the objective changes, rolling a covered call is a commonly used strategy. Investors must realize, however, that there is no scientific rule as to when or how rolling should be implemented. Should the existing covered call be closed and replaced with another call? If yes, should the new call have a higher strike price or a later expiration date? There is no right or wrong answer to such questions. Rolling a covered call is a subjective decision that every investor must make independently.
Rolling up
Rolling up involves buying to close an existing covered call and simultaneously selling another covered call on the same stock and with the same expiration date but with a higher strike price.
Here is an example of how rolling up might come about. In the initial situation stock XYZ is trading at $79.00 per share, and the investor believes that it will trade in a narrow range for the next 60 days. The investor, therefore, initiates a covered write position by buying 100 XYZ shares and selling 1 XYZ March 80 call. Subsequently, the price of XYZ rises to $83.00, and the investor “rolls up” the March 80 call to the March 85 call. There is a net cost for rolling up, but the result is a higher maximum profit potential. Here are the details.
| Initial situation: | XYZ stock is trading at $79.00
60 days to March expiration |
| Step 1: | Buy 100 shares of XYZ stock @ $79.00 per share
Sell 1 XYZ March 80 call @ $2.50 per share |
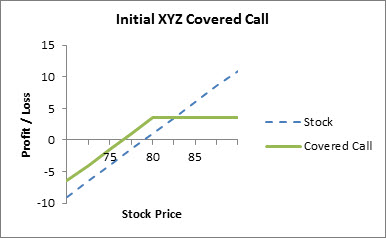
Comment: This initial covered call position has a maximum profit potential of $3.50 per share and a break-even stock price of $76.50. The maximum profit potential is calculated by adding the call premium to the strike price and subtracting the purchase price of the stock, or:
Maximum profit potential = (strike price + call premium) – purchase price of stock
Maximum profit potential = ($80.00 + $2.50) – $79.00 = $3.50
The break-even stock price is calculated by subtracting the call premium from the purchase price of the stock, or:
Break-even stock price = purchase price of stock – call premium
Break-even stock price = $79.00 – $2.50 = 76.50
The initial XYZ covered call position is shown in graph 1.
Graph 1 – The Initial XYZ Covered Call (Step 1)

| New situation: | XYZ stock is trading at $83.00
25 days to March expiration |
| Step 2: | Roll up: Buy 1 XYZ March 80 call @ $4.00 per share
Sell 1 XYZ March 85 call @ $2.00 per share Net cost per share = $2.00 |
Comment: The action involved in “rolling up” has two parts: buying to close the March 80 call and selling to open a March 85 call. The new covered call position is “long 100 shares of XYZ and short 1 March 85 call.” The investor is now obligated to sell the XYZ shares at $85.00 instead of $80.00 per share. Although this is an increase of $5.00 per share if the 85 call is assigned, the net cost of getting this increase in strike price is $2.00 per share.
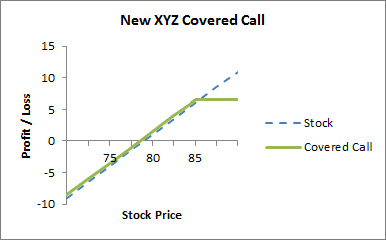
The new maximum profit potential is $6.50 per share and the new break-even stock price is $78.50. The new maximum profit potential is calculated by adding the original maximum profit to the difference in strike prices minus the net cost of rolling up, or:
New max profit potential = (orig max profit + diff in strike prices) – net cost of rolling up
New max profit potential = ($3.50 + $5.00) – $2.00 = $6.50
The new break-even stock price is calculated by adding the net cost of rolling up to the original break-even stock price, or:
New break-even stock price = orig break-even stock price + net cost of rolling up
New break-even stock price = $76.50 + $2.00 = $78.50
The new XYZ covered call position after step 2 is shown in graph 2.
Graph 2 – The New XYZ Covered Call (after Step 2)

Rolling down
Rolling down involves buying to close an existing covered call and simultaneously selling another covered call on the same stock and with the same expiration date but with a lower strike price.
Here is an example of how rolling down might come about. In the initial situation, stock QRS is trading at $54.00 per share, and the investor believes that it will trade in a narrow range for the next 60 days. The investor, therefore, initiates a covered write position by buying 100 QRS shares and selling 1 QRS July 55 call. Subsequently, the price of QRS falls to $51.50, and the investor “rolls down” the July 55 call to the July 50 call. A net credit is received for rolling down and a lower break-even point is achieved, but the result is a lower maximum profit potential. Here are the details:
| Initial situation: | QRS stock is trading at $54.00
60 days to July expiration |
| Step 1: | Open a covered call position:
Buy 100 shares of QRS stock @ $54.00 per share Sell 1 QRS July 55 call @ $2.00 per share |
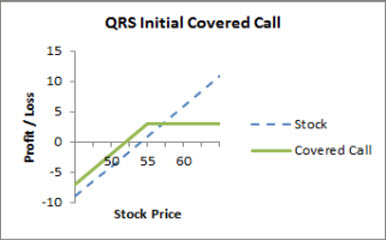
Comment: This initial covered call position has a maximum profit potential of $3.00 per share and a break-even stock price of $52.00. The maximum profit potential is calculated by adding the call premium to the strike price and subtracting the purchase price of the stock, or:
Maximum profit potential = (strike price + call premium) – purchase price of stock
Maximum profit potential = ($55.00 + $2.00) – $54.00 = $3.00
The break-even stock price is calculated by subtracting the call premium from the purchase price of the stock, or:
Break-even stock price = purchase price of stock – call premium
Break-even stock price = $54.00 – $2.00 = $52.00
The initial QRS covered call position is shown in graph 3.
Graph 3 – The Initial QRS Covered Call (Step 1)

| New situation: | QRS stock is trading at $51.50
35 days to July expiration |
| Step 2: | Roll down: Buy 1 QRS July 55 call @ $0.25 per share
Sell 1 QRS July 50 call @ $2.75 per share Net credit per share $2.50 |
Comment: The action involved in rolling down has 2 parts: buying to close the July 55 call and selling to open a July 50 call. The new covered call position is “long 100 shares of QRS and short 1 QRS July 50 all.” The investor is now obligated to sell the XYZ shares at $50.00 instead of $55.00 per share. Although this is a decrease of $5.00 per share if the 50 call is assigned, a net credit of $2.50 per share was received for accepting this decrease in strike price.
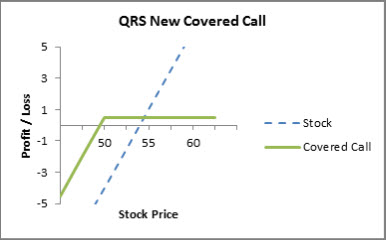
The new maximum profit potential is $0.50 per share and the new break-even stock price is $49.50. The new maximum profit potential is calculated by subtracting the difference between the strike prices from the original maximum profit and adding the net credit received for rolling down, or
New max profit potential = (orig max profit – diff in strike prices) + net credit received
New max profit potential = ($3.00 – $5.00) + $2.50 = $0.50
The new break-even stock price is calculated by subtracting the net credit received from the original break-even stock price, or:
New break-even stock price = orig break-even stock price – net credit received
New break-even stock price = $52.00 – $2.50 = $49.50
The new QRS covered call position after step 2 is shown in graph 4.
Graph 4 – The New QRS Covered Call (after Step 2)

Rolling out
Rolling out involves buying to close an existing covered call and simultaneously selling another covered call on the same stock and with the same strike price but with a later expiration date.
For example, assume that 55 days ago you initiated a covered call position by buying TTT stock and selling 1 September 35 call. At that time, TTT was trading at $33.80 per share. Since then TTT has traded in a narrow range near $35.00, just as you forecast. Today, which is 5 days before the September expiration, TTT is trading at $34.40 per share, and you believe it will continue to trade near $35.00 for the next 60 days. You therefore “roll out” your September 35 call to the November 35 call as follows:
| Example of rolling out: | Buy 1 TTT September 35 call @ ($0.10) per share |
| (Sep 12, TTT @ $34.40) | Sell 1 TTT November 35 call @ $1.80 per share |
| Net credit per share $1.70 |
The benefit of rolling out is that an investor receives more option premium, which can be kept as income if the new call expires. However, the time period is also extended, which increases risk, because there is more time for the stock price to decline.
Rolling out is a valuable alternative for income-oriented investors who have confidence in their stock price forecast and who can assume the risk of that forecast being wrong.
Rolling up and out
Rolling up and out involves buying to close an existing covered call and simultaneously selling another covered call on the same stock but with a higher strike price and a later expiration date.
For example, assume that 80 days ago you initiated a covered call position by buying CXC stock and selling 1 May 90 call. At that time, CXC was trading at $88.00 per share. Since then CXC has traded higher and is now at $93.00. Today, which is 25 days before the May expiration, and you believe that CXC will continue to trade near $95.00 for the next 75 days. You therefore “roll up and out” to the July 95 call as follows:
| Example of rolling up and out: | Buy 1 CXC May 90 call @ ($3.90) per share |
| (April 25, CXC @ $93.00) | Sell 1 CXC July 95 call @ $4.60 per share |
| Net credit per share $0.70 |
Rolling up and out is a valuable alternative for income-oriented investors who believe that a stock will continue to trade at or above the current level until the expiration of the new covered call.
Rolling down and out
Rolling down and out involves buying to close an existing covered call and simultaneously selling another covered call on the same stock but with a lower strike price and a later expiration date.
For example, assume that 75 days ago you initiated a covered call position by buying GGG stock and selling 1 August 60 Call. At that time, GGG was trading at $59.00 per share. Since then GGG has traded lower and is now at $53.00. Today is 10 days before the August expiration, and you believe that GGG will continue to trade between $50.00 and $55.00 for the next 70 days. You therefore roll down and out to the October 55 call as follows:
| Example of rolling down and out: | Buy 1 GGG August 60 call @ ($0.10) per share |
| (August 7, GGG @ $53.00) | Sell 1 GGG October 55 call @ $2.30 per share |
| Net credit per share $2.20 |
The benefit of rolling down and out is that an investor receives more option premium and lowers the break-even point. However, the maximum profit potential is reduced and the time period is also extended, which increases risk.
Rolling down and out is a valuable alternative for income-oriented investors who want to make the best of a bad situation if they believe that a stock will continue to trade at or above the current level until the expiration of the new covered call.
Key takeaways
Stock prices do not always cooperate with forecasts. Also, forecasts and objectives can change. As a result, investors who use covered calls should know about the basic rolling techniques in case they are ever needed. Unfortunately, there is no right or wrong method of rolling a covered call. The decision to roll is a subjective one that every investor must make individually.
Rolling a covered call involves a two-part trade in which the covered call sold initially is closed out (with a buy-to-close order) and another covered call is sold to replace it
|
|
|
| Rolling up | Buying to close an existing covered call and simultaneously selling another covered call on the same stock and with the same expiration date but with a higher strike price |
| Rolling down | Buying to close an existing covered call and simultaneously selling another covered call on the same stock and with the same expiration date but with a lower strike price |
| Rolling out | Buying to close an existing covered call and simultaneously selling another covered call on the same stock and with the same strike price but with a later expiration date |
| Rolling up and out | Buying to close an existing covered call and simultaneously selling another covered call on the same stock but with a higher strike price and a later expiration date |
| Rolling down and out | Buying to close an existing covered call and simultaneously selling another covered call on the same stock but with a lower strike price and a later expiration date |


