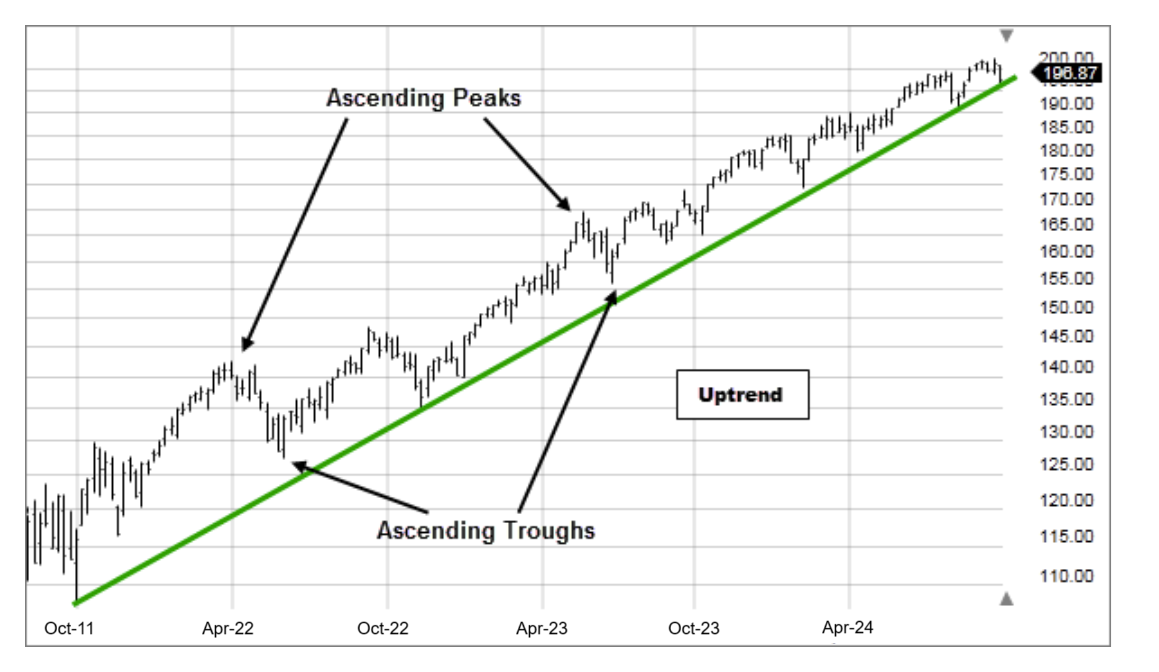
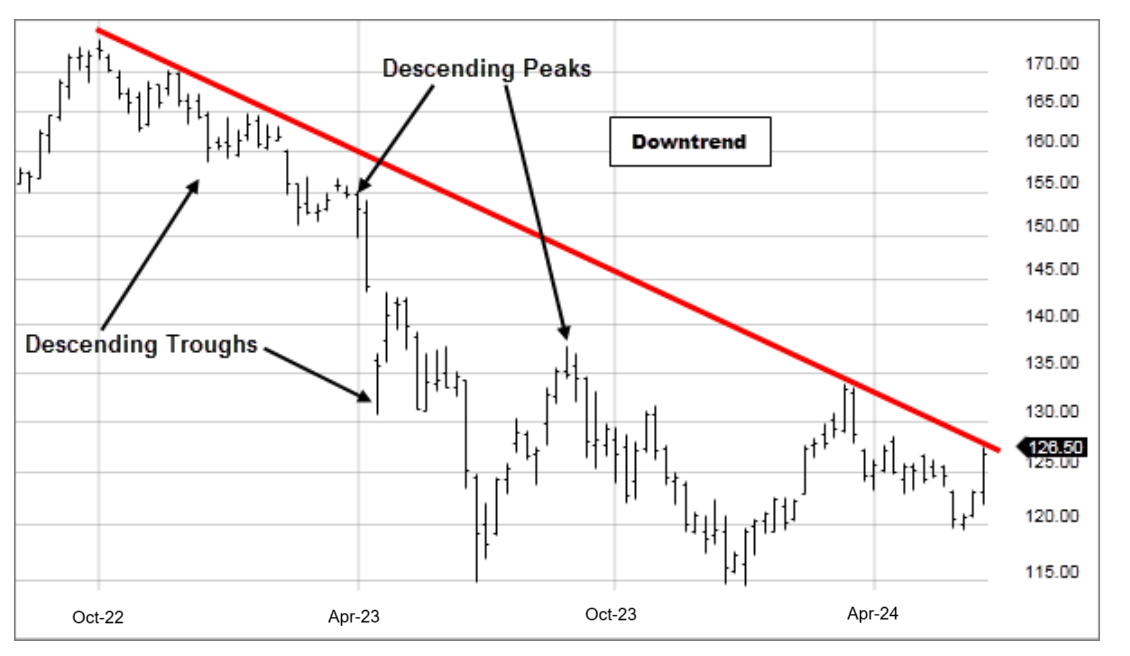
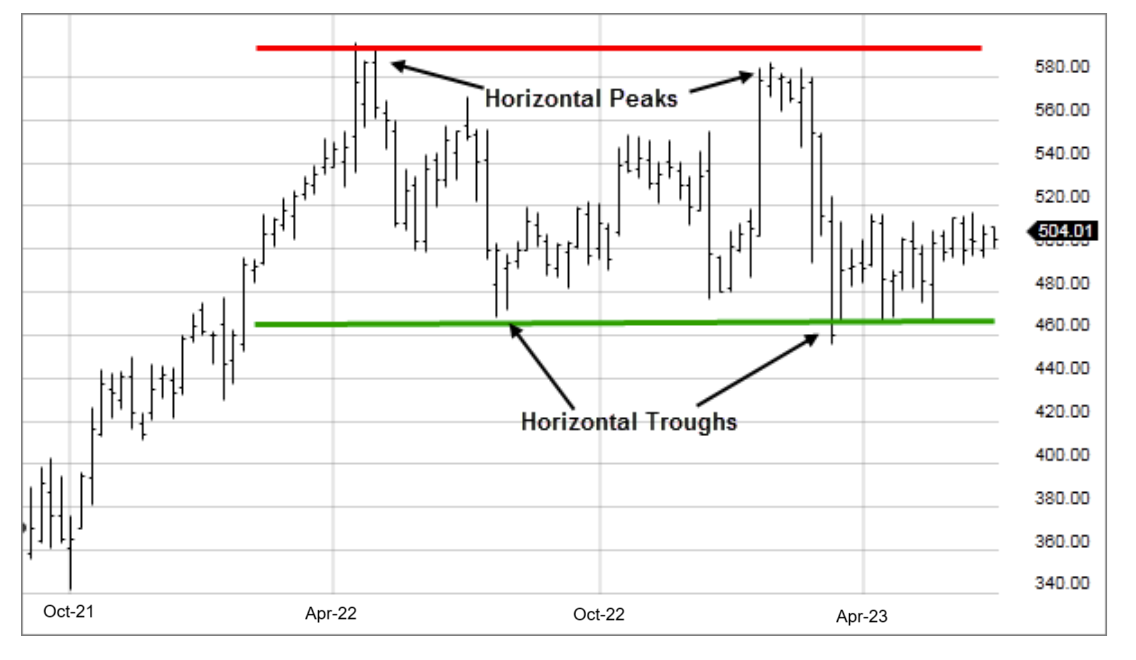
Trend is the direction that prices are moving in, based on where they have been in the past. Trends are made up of peaks and troughs. It is the direction of those peaks and troughs that constitute a market’s trend. Whether those peaks and troughs are moving up, down, or sideways indicates the direction of the trend.
3 directions of trend
1. An uptrend is made up of ascending peaks and troughs. Higher highs and higher lows.
2. A downtrend is made up of descending peaks and troughs. Lower highs and lower lows.
3. A sideways trend (consolidation) is when prices move sideways in a horizontal range.
3 trend lengths
Charles Dow developed a series of principles for understanding and analyzing market behavior, which later became known as Dow Theory, the cornerstone of the study of technical analysis. Charles Dow believed that prices moved in waves or trends. He believed that much like a rising tide where the waves would move farther up the beach with each ebb and flow, and cause smaller ripples, so too would rising stock prices. Conversely, once the tide had peaked and changed to move farther down the beach until low tide, so too would stock prices. This may seem like a simple concept, but it is part of the foundation of the modern study of trends in stock prices.
Trend lengths:
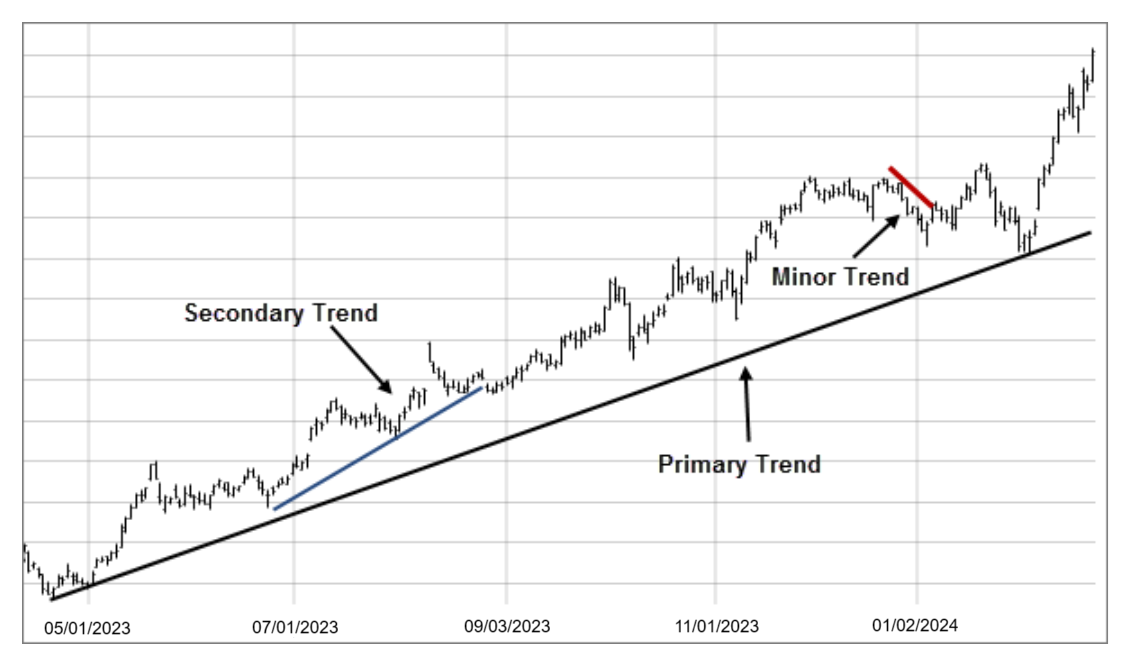
- Primary – Long-term (i.e., 1 year or longer): the tide in Dow's explanation
- Secondary – Intermediate (i.e., 1 to 3 months): the waves
- Minor – Short-term (i.e., less than 1 month): the ripples
Trends are affected by the next longer and next shorter trend. A rising primary/long-term trend causes the secondary/intermediate trend to have larger rallies and smaller retracements, and the minor/short-term trend causes the secondary/intermediate-term trend to ebb and flow. A falling primary/long-term trend causes the secondary/intermediate-term trend to have smaller rallies and larger retracements, while the minor/short-term trend, again, causes the secondary/intermediate-term trend to ebb and flow.
Trend lines
One way for an analyst to see the trend is by drawing what are called trend lines. A trend line is a straight line that connects 2 or more price points and then extends into the future to act as a line of support or resistance. Many of the principles applicable to support and resistance levels can be applied to trend lines as well.
Uptrend line
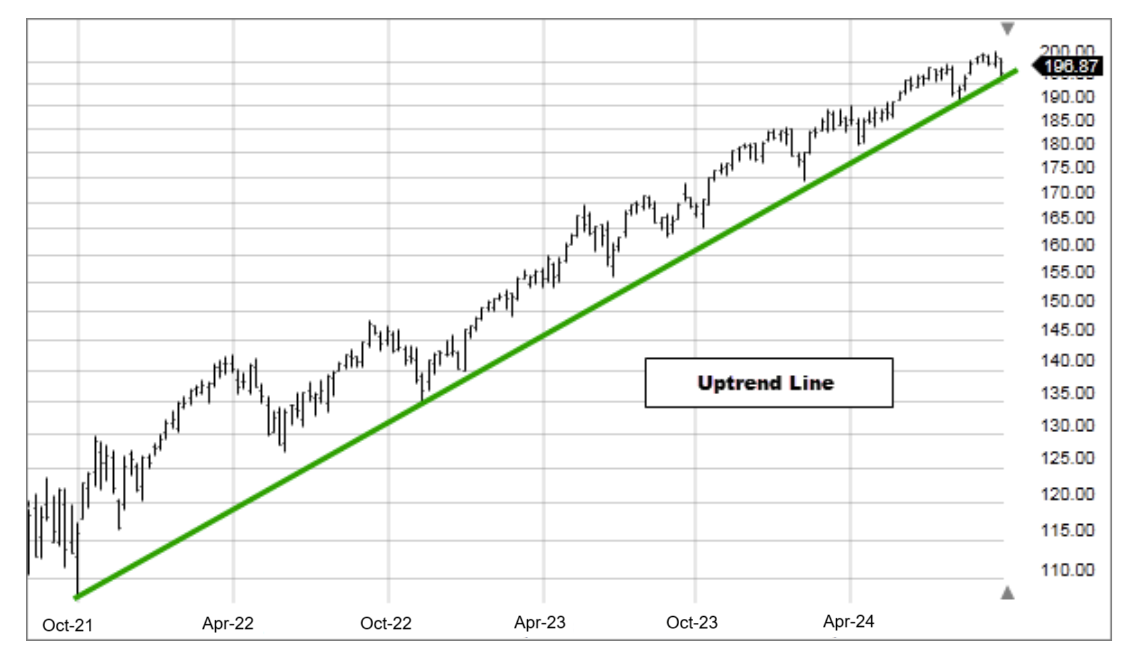
An uptrend line is a straight line drawn upward to the right that connects 2 or more low points. The second low must be higher than the first for the line to have an upward incline. Uptrend lines act as support and indicate that there is more demand than supply, even as the price rises. As long as prices remain above the trend line, the uptrend is considered to be intact. A break below the uptrend line indicates that a change in trend may be occurring.
Downtrend line
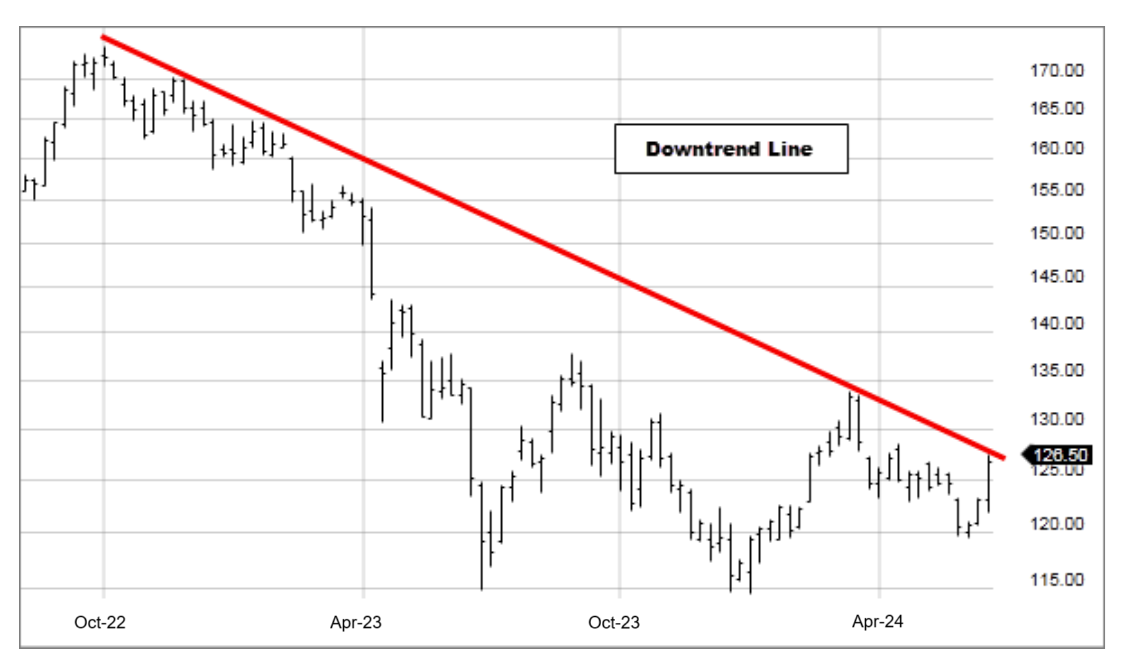
A downtrend line is a straight line drawn downward to the right that connects 2 or more high points. The second high must be lower than the first for the line to have a downward incline. Downtrend lines act as resistance and indicate that there is more supply than demand, even as the price falls. As long as prices remain below the trend line, the downtrend is considered to be intact. A break above the downtrend line indicates that a change in trend may be occurring.
Conclusion
Using trend and trend line analysis is an important aspect of technical analysis, but keep in mind that it's only one of the many tools and techniques available. When a trend line is broken, it should serve only as a warning that the trend may be changing. You should use additional tools and signals to confirm the change in trend.

