
Estimate Time4 min

Chart of the week: Gold hits 2026 low

Since hitting an all-time high above $5,500 per ounce in late January, gold has fallen roughly 25% to trade near $4,100, as of early July. Record central bank buying and falling rates had helped propel the precious metal to new heights in 2025 and at the outset of this year. But a slowdown in demand alongside a pause in rate cuts by the US central bank have combined to cool momentum behind the yellow metal.
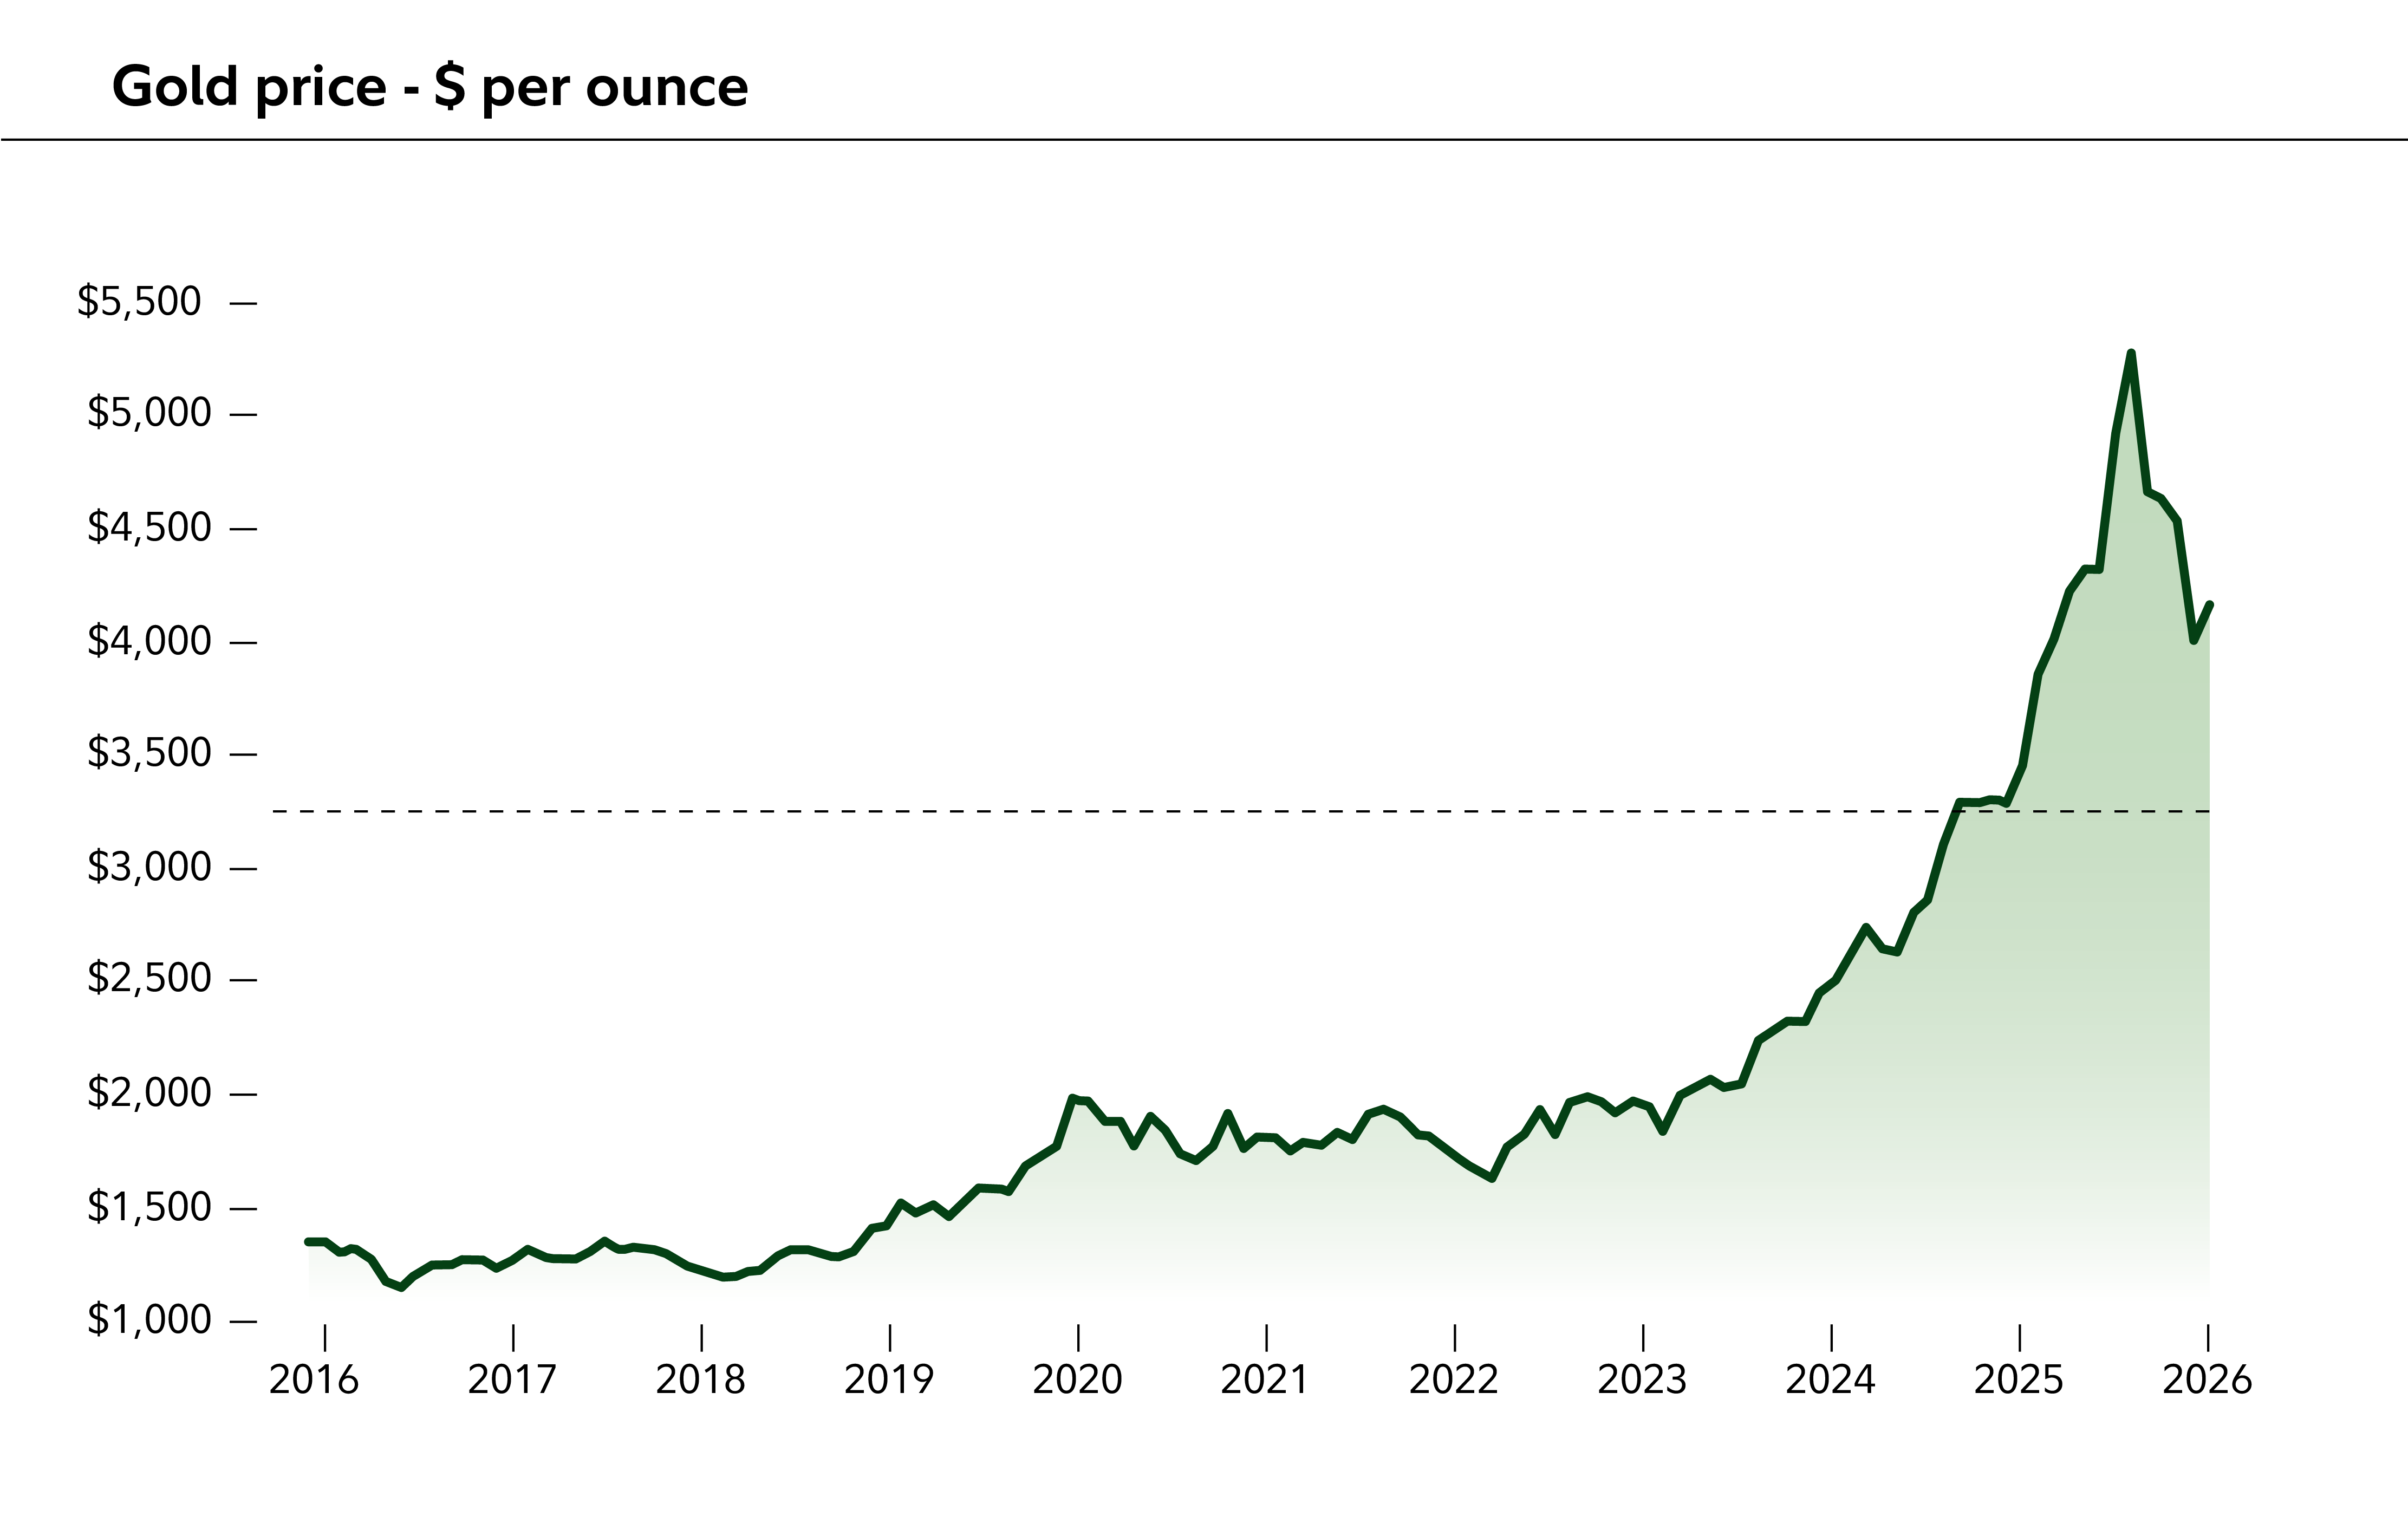
Chart describes gold price
Source: FactSet, as of July 9, 2026.

Choose the criteria. See stocks that match.

Our Stock Screener matches your ideas with potential investments.

More to explore

Get started trading

Get industry-leading research, guidance, tools, and pricing. Open an account.

Past performance is no guarantee of future results.

The gold industry can be significantly affected by international monetary and political developments such as currency devaluations or revaluations, central bank movements, economic and social conditions within a country, trade imbalances, or trade or currency restrictions between countries.

Fluctuations in the price of gold often dramatically affect the profitability of companies in the gold sector.

Changes in the political or economic climate, especially in gold producing countries such as South Africa and the former Soviet Union, may have a direct impact on the price of gold worldwide.

The gold industry is extremely volatile, and investing directly in physical gold may not be appropriate for most investors.

Bullion and coin investments in FBS accounts are not covered by either the SIPC or insurance "in excess of SIPC" coverage of FBS or NFS.

Keep in mind that investing involves risk. The value of your investment will fluctuate over time, and you may gain or lose money.

Fidelity Brokerage Services LLC, Member NYSE, SIPC, 900 Salem Street, Smithfield, RI 02917

1099725.148.0