

Volatile yet resilient could end up describing the stock market in 2026. Stocks are marginally higher year-to-date despite tariff disputes, global conflicts, relatively high valuations, and other risks that have led to some large price moves.
Given how frequently major market news has been happening, active investors may want to consider shortening their time horizons for individual trades. What do the charts say for the near term? After the latest tariff flareup, Bollinger Bands suggest the short-term trend is bullish.
What Bollinger Bands say about stocks now
Bollinger Bands are a short-term trading tool that can help you decide when to make your move by assessing the relative strength or momentum of an investment. This indicator looks like an envelope that forms an upper and lower band around the price. Between the 2 bands a moving average can be plotted—typically a short-term simple moving average (SMA).1 In addition to other signals, John Bollinger, who created this indicator, considers the price relatively low (attractive) if it is near the lower band and relatively high (overvalued) if it's near the upper band.
Currently, the S&P 500 is trading near the middle of the band, but did cross above the moving average generating a buy signal. The upper part of the band would represent the new target.
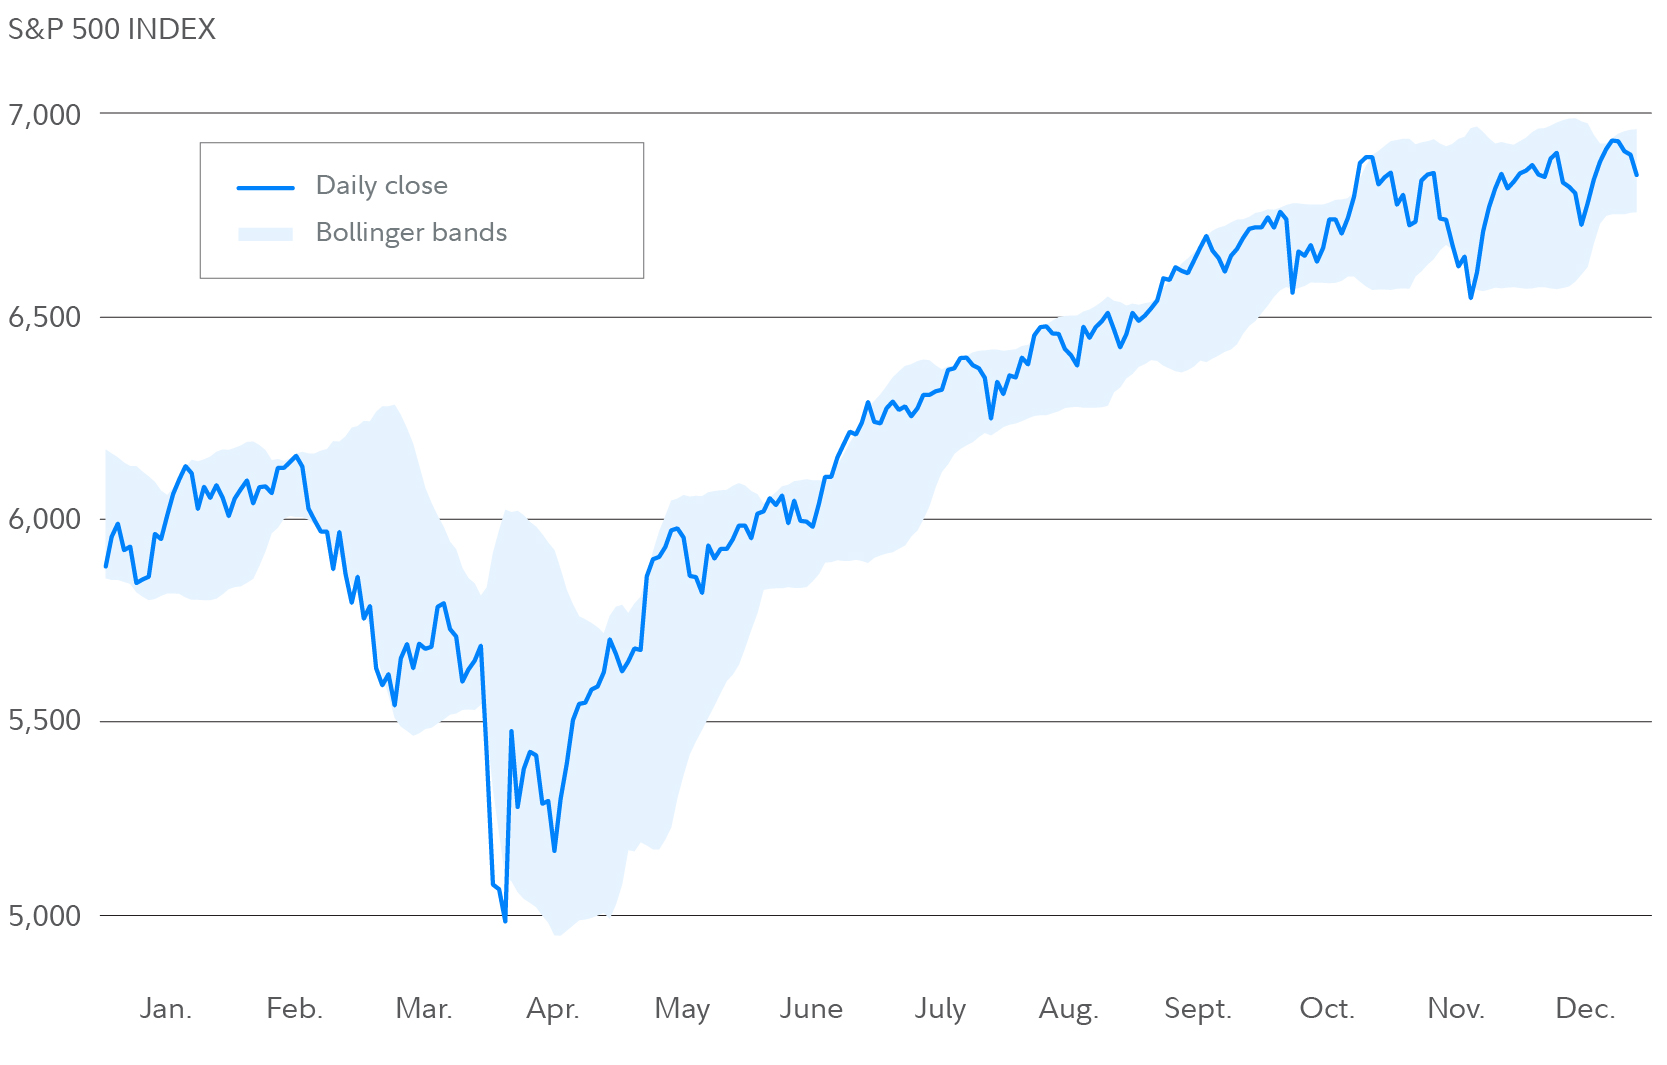
In addition to moves within the bands, price moves outside of the bands can generate signals. If the S&P 500 were to move lower and there is a breakthrough of the lower part of the band, that would generate a sell signal by breaking through a support level. Alternatively, if the S&P 500 were to rally and there is a breakthrough of the upper part of the band, that would generate a buy signal by breaking through a potential resistance level.
Volatility and Bollinger Bands
Bollinger Bands can also help assess volatility. Narrowing Bollinger Bands (i.e., when the bands move closer together) could suggest that volatility is decreasing—as investor sentiment potentially becomes more optimistic or complacent. A Bollinger Band "squeeze" occurs when volatility reaches a relative low. This squeeze can be followed by a period of increased volatility and may result in a significant move by the stock to the upside or the downside.
When the bands separate by a large amount, volatility may be seen as increasing and any existing trend may be ending. Recently, Bollinger Bands for the S&P 500 have narrowed somewhat, although a squeeze seems unlikely, given how volatile markets have already been thus far this year.
Advanced use of Bollinger Band
An advanced application of Bollinger Bands involves another indicator: the relative strength index (RSI). Bollinger Bands can be applied around the RSI line to assess additional buy and sell signals.
When RSI is near an extreme high (~100) or low (~0), and is touching either the high part of the upper band or the low part of the lower band, the RSI line could pull back sharply from the band. Bollinger Band analysis holds that a failure of RSI to touch the upper band on a second try generates a sell signal. At extreme lows, a failure of RSI to reach the lower band triggers a buy signal. This is similar to double top and double bottom patterns, respectively, that can occur for the price. Currently, RSI is not near extreme highs or lows.
How to use Bollinger Bands
It goes without saying that you shouldn’t make investing decisions based only on the signals given by a single indicator or data point. Bollinger Bands can be used in combination with other research, and you should always consider the risk that the signal does not pan out. But if you actively trade, keep an eye on as much information as you can—including what’s happening in the charts.