Estimate Time6 min

The hidden risks of investing conservatively

Key takeaways

  • Investments that are less exposed to market volatility can play an important role in your overall financial plan.
  • However, allocating too much to asset classes such as cash or fixed income may expose investors to risks they hadn’t considered.
  • Before making allocation adjustments, investors should consider the potential impacts of inflation, rising health care costs, and increased longevity.

When the headlines paint a worrisome picture, the economic outlook is uncertain, and markets are volatile, it’s understandable to want to play it safe with your portfolio. Or maybe you’re approaching retirement age and are beginning to think about how to make the money you’ve saved last long enough to maintain your desired lifestyle for your remaining years. Watching your account balance fluctuate with the market is hard enough when you’re still earning and retirement is decades away; it can be even harder when you need that money to pay for your day-to-day expenses.

While you may be tempted to pull back from the stock market and park your money in safer harbors, such as fixed income investments, or to pull it out of the market altogether and let your cash sit in a bank account, doing so won’t necessarily protect you from running out of assets. In fact, in some circumstances, adopting a more conservative portfolio allocation might actually increase the odds of having a shortfall late in retirement, leaving you without the assets you need precisely when you need them the most.

“People often think, ‘I’m retired, so I should be more conservative,’ rather than considering the practical realities of aging,” according to Riley Stallard, regional vice president, Planning Solutions at Fidelity Investments. “In the past, people’s retirements were relatively short, and because of that, the prospects of their portfolio recovering quickly enough to sustain their lifestyle after a market downturn were not very good. But that’s not necessarily the case today, for several reasons.”

Instead of making decisions based on what's going on in the markets, investors should base their choices on their personal circumstances: their long-term goals, their present financial situation, their time horizon, and, yes, their tolerance for risk. A closer look at these factors may show that short-term market volatility tends to have a limited effect on long-term objectives. Or it may reveal that a more aggressive asset allocation is necessary to help achieve your financial objectives, whatever they may be.

“As you age and approach retirement, your investment timeframe shortens—that’s one way to think about how you allocate your assets,” says Matt Bullard, regional vice president, Planning Solutions at Fidelity Investments. “But there’s more to consider. For instance, how much do you actually intend to use? You may discover that your necessary expenses are covered by retirement income sources such as pensions, Social Security, or annuities. If that’s the case, then it may not make sense to think about the assets that are left over in terms of your retirement timeframe. You may want to think about them in terms of your legacy. In that case, the timeframe gets much, much longer.”

While a more conservative allocation can certainly be a reasonable choice for many investors, it’s a decision that should be reached only after a thorough consideration of these factors—and not solely as a means of quelling anxieties about short-term economic and market performance. (There are other, more productive ways to handle those feelings: How to stay invested in volatile markets.)

Investments that are less exposed to market volatility can play an important role in your overall financial plan, especially for things like emergency savings or shorter-term spending needs. But allocating too much to asset classes such as cash or fixed income may be costly. That’s because despite the name, a conservative asset allocation is not entirely free of risk. Furthermore, these risks can be harder to detect and potentially more detrimental to your portfolio than you realize. Before you make any drastic changes, consider these 3 “hidden” risks that can present challenges for conservative investors.

Inflation

When is a dollar worth less than a dollar? It’s not a riddle—it’s a real question with an answer that may have consequences for your savings.

The answer is: The longer you hold onto it.

We’ve heard a lot about inflation over the last few years, and for good reason. In the years following the COVID-19 pandemic, inflation reached historic highs, and high inflation not only leads to higher prices for the goods and services you’ll need to spend money on, it can also reduce the purchasing power of the dollars you’re holding in your bank account. In short, a dollar in your bank account today may potentially be worth less—that is, won’t be able to buy as much—in the future.

“That’s a hidden cost of being in a conservative allocation,” says Bullard. “Because of inflation, your dollars may look stable, but in real terms, they’re shrinking.”

Even when inflation is at so-called “normal” levels (the Federal Reserve generally aims to keep inflation at around 2%), it’s subtly chipping away at your purchasing power. But because the number in your savings account or on the face of your dollar bill doesn’t budge, it’s easy to overlook that your uninvested cash is losing value over time, which can impact your overall financial plans.

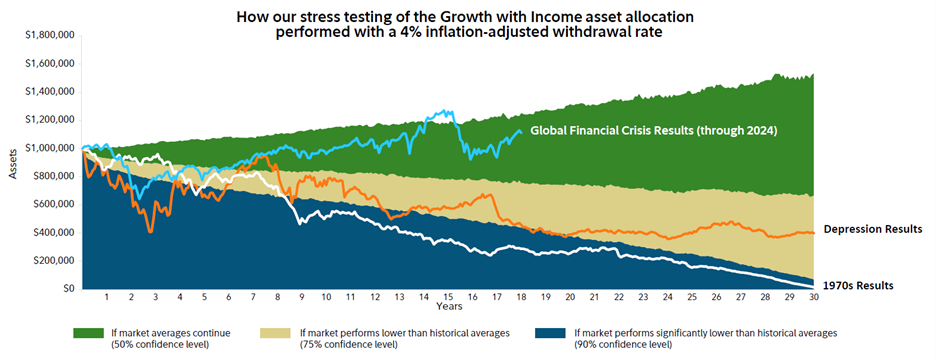
“Our research shows that the biggest risk to long-term sustainability may not be a short-term market event like the Great Depression or the Great Recession, but rather the type of high inflationary environment that we saw in the 1970s and ‘80s,” says Bullard.

Past performance is no guarantee of future results. Hypothetical Example.1 For illustrative purposes only. Growth with Income asset allocation: 60% equity, 35% bond, 5% short-term. Returns for individual clients will vary. Simulations are based on a historical performance analysis of asset class returns, including a range of potential returns for each asset class, volatility, and correlation, reviewed each year. Results are graphed based on how an asset mix may have performed, given the inputs and assumptions in the tool, in a certain percentage of the simulated market scenarios. These percentages are called “confidence levels.”

Health care costs

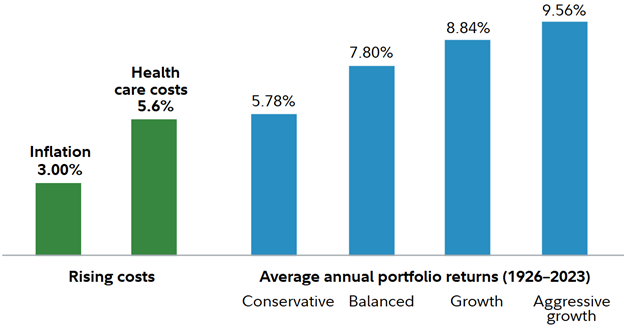
Benjamin Franklin once wrote that the only things certain in life were death and taxes, but if he were alive today, he’d likely want to add a third thing to his list: The cost of health care has historically shown an upward trend. In fact, according to the Centers for Medicare and Medicaid Services, a government agency, it’s projected that health care costs will rise by 5.6% annually through the year 2032. The average couple will likely need an estimated $345,000 to cover medical expenses in retirement, excluding long-term care.2

Like inflation, health care expenses can creep up on you. While it may be difficult to imagine now, it's possible that your health care needs may increase as you age, even if you don’t face a serious or chronic medical issue. So on top of health care getting more expensive in general, you are also likely to be spending more on it than you anticipate.

Longevity

The effects of inflation and health care expenses are both compounded by a third issue: Chances are, it’s possible that you may live longer than you expect. That’s great. But that means you’ll need to take steps to help ensure that your assets aren’t just stable but have enough growth potential to support you throughout your retirement.

This graph is for illustrative purposes only and does not represent actual or implied performance of any investment option. Data for health care costs is from the Centers for Medicare and Medicaid Services, National Health Expenditures Estimates 2023–2032. All indices are unmanaged, and it is not possible to invest directly in an index. Past performance is no guarantee of future results. Returns include the reinvestment of dividends and other earnings. Data source: Morningstar Inc., 2024 (1926–2023 ). Domestic stocks are represented by the S&P 500® index, bonds are represented by U.S. Intermediate Government Bond Index, and short-term assets are based on the 30-day U.S. Treasury bill. Foreign equities are represented by the MSCI Europe, Australasia, and Far East Index for the period from 1970 to the last calendar year. Foreign equities prior to 1970 are represented by the S&P 500 ® index. Inflation is represented by the Consumer Price Index. U.S. stock prices are more volatile than those of other securities. Government bonds and corporate bonds have more moderate short-term price fluctuation than stocks but provide lower potential long-term returns. U.S. Treasury bills maintain a stable value (if held to maturity), but returns are generally only slightly above the inflation rate. Asset allocation does not ensure a profit or protect against a loss.

“People are living longer, costs are rising, and medicine keeps improving,” says Stoddard. "It’s possible that you could live for a significant number of years in retirement—potentially even longer than you worked. The greatest risk to making your money last may not be the market; it may be that you’ve become conservative too prematurely, which could result in passing up the potential for compounding growth that could sustain you through the rest of your life.”

Understand the different types of risk

“It’s important to consider the pros and cons of different types of risk,” says Bullard. “There’s potential upside to the risk you are exposed to when you invest in the stock market. You may end up with more to leave to your kids and grandkids if you’re willing to endure a little volatility from time to time. But the risks you are exposed to when you choose a more conservative allocation have the potential to undermine your ability to reach your long-term retirement and wealth-transfer goals. Risk is a tool, and the ultimate question is: What type of risk is right for you?”

An asset allocation attuned to your personal needs and long-term goals, paired with a withdrawal and spending strategy that is conscious of the risks you face in retirement, can help to ensure that you enter your golden years with confidence. With the right plan in place, an investor could potentially shrug off the short-term volatility that might otherwise compel them to react emotionally and lead to the kind of knee-jerk decision that could potentially threaten their ability to sustain their assets over time.

Still, if this all seems easier said than done, it may be wise to consult with an experienced financial professional who can provide you with the context and coaching necessary to help find the appropriate asset mix for you so you can face these challenges head on. (Learn more: How an advisor can help you reach your retirement goals.)

Start a conversation

Already working 1-on-1 with us?
Schedule an appointmentLog In Required

More to explore

1. The Tool uses Monte Carlo simulations to project a range of hypothetical market return scenarios. Simulations are based on a historical performance analysis of asset class returns, including a range of potential returns for each asset class, volatility, and correlation, reviewed each year. Asset classes are represented by benchmark return data from Morningstar, Inc., not actual investments. • Domestic equities are represented by the S&P 500® Index from the year 1926 through 1986 and the Dow Jones U.S. Total Market Index SM from 1987 on. • Foreign equities are represented by the S&P 500® Index from 1926 through 1969, the MSCI EAFE Index from 1970 through 2000, and the MSCI ACWI Ex USA Index from 2001 on. • Bonds are represented by U.S. intermediate-term bonds from 1926 through 1975 and the Bloomberg U.S. Aggregate Bond Index from 1976 on. • Short-Term investments are represented by 30-day U.S. Treasury bill rates from 1926 on. Indexes are unmanaged and it is not possible to invest directly in an index. See page 14 for index definitions. Annual returns assume the reinvestment of interest income and dividends, no transaction costs, no management or servicing fees (except for a variable annuity fees), and the rebalancing of the portfolio every year. Performance returns for actual investments will generally be reduced by fees and expenses not reflected in these hypothetical illustrations. The Tool graphs results based on how an asset mix may have performed, given your inputs and assumptions in the Tool, in a certain percentage of the simulated market scenarios. The Tool uses the same simulated market scenarios each visit, unless otherwise updated. These percentages are called “confidence levels.” For example, the default confidence level is 90%, which we consider “very conservative” market performance. This means that in 90% of the historical market scenarios run, a particular asset mix performed at least as well as the results shown. Conversely, in only 10% of the historical market scenarios run, a particular asset mix failed to reach the results shown. The Tool uses this 90% figure so as to err on the side of a more conservative estimation of future market performance. Results are available for viewing at the 50%, 75%, and 90% confidence levels as described in the following chart:
Market Conditions Performance Assumptions Fail Performance Assumptions Meet or Exceed Confidence Level
If markets perform significantly lower than historical averages 10 out of 100 times 90 out of 100 times 90% (Significantly below average)
If markets perform lower than historical averages 25 out of 100 times 75 out of 100 times 75% (Below average)
If market averages continue 50 out of 100 times 50 out of 100 times 50% (Average)

Although past performance does not guarantee future results, it may be useful in comparing investment strategies over the long term. Average annual returns are hypothetical, and, if achieved annually, would have produced the same cumulative total return if performance had been constant over the entire period. Average annual total returns simply smooth out variation in performance; they are not the same as actual year-by-year results.

2. The 2025 Retiree Health Care Cost Estimate is based on a single person retiring in 2025, 65 years old, with life expectancies that align with Society of Actuaries' RP-2014 Healthy Annuitant rates projected with Mortality Improvements Scale MP-2020 as of 2022. Actual assets needed may be more or less depending on actual health status, area of residence, and longevity. Estimate is net of taxes. The Fidelity Retiree Health Care Cost Estimate assumes individuals do not have employer-provided retiree health care coverage, but do qualify for the federal government’s insurance program, original Medicare. The calculation takes into account Medicare Part B base premiums and cost-sharing provisions (such as deductibles and coinsurance) associated with Medicare Part A and Part B (inpatient and outpatient medical insurance). It also considers Medicare Part D (prescription drug coverage) premiums and out-of-pocket costs, as well as certain services excluded by original Medicare. The estimate does not include other health-related expenses, such as over-the-counter medications, most dental services and long-term care.

Keep in mind that investing involves risk. The value of your investment will fluctuate over time, and you may gain or lose money.

Past performance is no guarantee of future results.

This information is intended to be educational and is not tailored to the investment needs of any specific investor.

Indexes are unmanaged. It is not possible to invest directly in an index.

Diversification and asset allocation do not ensure a profit or guarantee against loss.

All indexes are unmanaged, and performance of the indexes includes reinvestment of dividends and interest income, unless otherwise noted. Indexes are not illustrative of any particular investment, and it is not possible to invest directly in an index.

The S&P 500® Index is a market capitalization–weighted index of 500 common stocks chosen for market size, liquidity, and industry group representation to represent U.S. equity performance. Dow Jones Industrial Average, published by Dow Jones & Company, is a price–weighted index that serves as a measure of the entire US market. The index comprises 30 actively traded stocks, covering such diverse industries as financial services, retail, entertainment, and consumer goods. The Bloomberg US Aggregate Bond Index is a broad-based flagship benchmark that measures the investment grade, US dollar-denominated, fixed-rate taxable bond market. The index includes Treasuries, government-related and corporate securities, mortgage-back securities (agency fixed-rate pass-throughs), asset-backed securities and collateralized mortgage backed securities (agency and non-agency). MSCI EAFE Index is a market capitalization-weighted index that is designed to measure the investable equity market performance for global investors of developed markets, excluding the U.S. & Canada. Index returns are adjusted for tax withholding rates applicable to U.S. based mutual funds organized as Massachusetts business trusts (NR). MSCI ACWI (All Country World Index) ex USA Index is a market capitalization-weighted index designed to measure the investable equity market performance for global investors of large and mid-cap stocks in developed and emerging markets, excluding the United States. The index covers approximately 85% of the free float-adjusted market capitalization in each country. The Barclays US Intermediate Government Bond Index is a market value–weighted index of US government fixed-rate debt issues with maturities between one and 10 years. The Consumer Price Index (CPI) is a measure of the average change over time in the prices paid by urban consumers for a market basket of consumer goods and services. Indexes are available for the U.S. and various geographic areas. Average price data for select utility, automotive fuel, and food items are also available.

Views expressed are as of the date indicated, based on the information available at that time, and may change based on market or other conditions. Unless otherwise noted, the opinions provided are those of the speaker or author and not necessarily those of Fidelity Investments or its affiliates. Fidelity does not assume any duty to update any of the information.

Investment decisions should be based on an individual’s own goals, time horizon, and tolerance for risk.

In general, the bond market is volatile, and fixed income securities carry interest rate risk. (As interest rates rise, bond prices usually fall, and vice versa. This effect is usually more pronounced for longer-term securities.) Fixed income securities also carry inflation risk, liquidity risk, call risk, and credit and default risks for both issuers and counterparties. Unlike individual bonds, most bond funds do not have a maturity date, so holding them until maturity to avoid losses caused by price volatility is not possible. Any fixed income security sold or redeemed prior to maturity may be subject to loss.

Fidelity advisors are licensed with Strategic Advisers LLC (Strategic Advisers), a registered investment adviser, and registered with Fidelity Brokerage Services LLC (FBS), a registered broker-dealer. Whether a Fidelity advisor provides advisory services through Strategic Advisers for a fee or brokerage services through FBS will depend on the products and services you choose.

Fidelity Brokerage Services LLC, Member NYSE, SIPC, 900 Salem Street, Smithfield, RI 02917

1241972.1.0